Iowa’s 20 Safest Cities of 2021

The SafeWise Team is pleased to release the seventh annual Safest Cities report.
Here are the 10 Safest Cities in Iowa for 2021
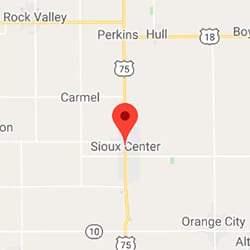
1. Sioux Center
2. Eldridge
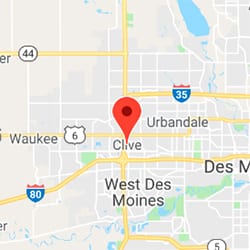
3. Clive
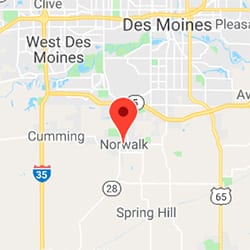
4. Norwalk
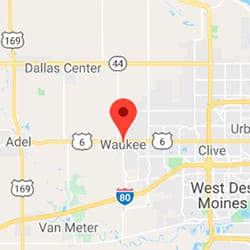
5. Waukee
6. Urbandale
7. Charles City
8. Decorah
9. Pella
10. Spencer
See if your city made the full list.
Tensions aren’t as high in The Hawkeye State in 2021 as other states. According to our survey, 45% of Iowans feel high levels of concern on a daily basis about their safety and 64% feel safe at home in Iowa.
While Iowans went from 31% concerned last year to 45% this year, Iowa shows lower levels of concern on more specific issues like property and violent crime and police and gun violence.
2021 Iowa crime rates
Iowan’s lack of concern isn’t unwarranted, though. Violent and property crime rates are safely below the national and regional rates despite a slight rise in violent crime in the last year.

Level of concern and experience with crime in Iowa
Iowans are generally less concerned than other states about violent crime, property crime, package theft, gun violence, police violence, and COVID-19. And while package theft is Iowa’s biggest concern, only 16% of our survey respondents experienced it in the last year (compared to the 20% nationally).
And, though we saw a drop in the number of respondents who experienced violent and property crime, there was a slight rise in those who experienced gun violence in the last 12 months.

Crime concerns in Iowa
We asked Iowans which crimes they worry may happen to them. See if Iowa residents are concerned about the same crime issues as the rest of the country.

View the complete 2021 State of Safety report.
Violent crime in Iowa: Fear vs. reality
Violent crime in Iowa has ticked up slightly in the last year but still sits well below the national and regional average. We saw these low crime levels reinforced by low numbers of those who carry personal protection or invest in protecting their property.
- Aggravated assault was the most common violent crime in the safest cities and statewide. It accounted for 64% of violent crime in the safest cities and 75% of violent crime across the state.
- Rape accounted for over a quarter of violent crime within the safest cities, higher than across the state (19%).
- 8 of the 20 safest cities saw fewer than 10 violent crimes in the last year.
- Of the Iowans we surveyed, 28% feared being personally affected by a gun violence incident (US 38%).
- There was a rise in mass shooting incidents in Iowa from 2019 to 2020 (from 3 to 5), but the number of officer-involved shootings dropped from 18 to 14.
- 40% of Hawkeyes worry about police violence on a daily basis while 57% have confidence in Iowan law enforcement.
- In Iowa, 26% of folks use some form of personal protection like pepper spray or stun guns. This is lower than the rest of the US (34%) and in line with Iowa’s lower levels of concern.
- 38% of Iowans we surveyed said their personal safety was affected by the COVID-19 pandemic.

Property crime in Iowa: Fear vs. reality
Iowa saw a rise in property crime over the last year going from 16.9 incidents per 1,000 people to 17.3. While a rise in crime may sound alarming, The Hawkeye State still sees fewer property crimes than the region and nation as a whole.
This rise in property crime is unique to Iowa, considering most of the region saw a slight drop since 2020.
- Larceny-theft made up a higher percentage of property crimes within the safest cities (78%) than across the state (69%).
- Statewide, burglary made up 21% of property crimes committed in the last year, higher than the national average of 16% of property crime.
- Property crime in the safest cities made up 10% of property crimes statewide.
- 48% of Iowans use some form of property protection (US 62%) with firearms being the favorite method.
- 32% of Iowans say the security of their property has been affected by the pandemic.

A closer look at the safest cities in Iowa
For the purposes of this report, the terms “dangerous” and “safest” refer explicitly to crime rates as calculated from FBI crime data—no other characterization of any community is implied or intended.
- Due to lack of reporting in 2020, all of 2021 cities are new this year. However, 13 of the 20 appeared on our list in 2019.
- Sioux Center is the safest city in Iowa with a violent crime rate of 0.4 and a property crime rate of 2.7 per 1,000 people.
- 8 of Iowa’s safest cities have violent crime rates below 1 incident per 1,000 people.
- Eldridge only had 2 violent crimes in the last year, while Sioux Center had the fewest property crimes at 21 incidents.
- There were 3 murders in the safest cities over the last twelve months.
- Larceny-theft was the most common property crime within the safest cities with 4,335 incidences.
- 6 of the 20 cities had fewer than 100 property crime cases reported.

The 20 Safest Cities in Iowa
 Population7,688
 Median Income$73,856
 VC Rate 2021, 2020, 20190.4, N/A, 0.3
![Circle Property]() PC Rate 2021, 2020, 20192.7, N/A, 2.8
PC Rate 2021, 2020, 20192.7, N/A, 2.8

-
Population6,972
-
Median Income$69,710
-
VC Rate 2021, 2020, 20190.3, N/A, 0.9
![Circle Property]() PC Rate 2021, 2020, 20196.0, N/A, 7.8
PC Rate 2021, 2020, 20196.0, N/A, 7.8
-
Population17,305
-
Median Income$101,616
-
VC Rate 2021, 2020, 20190.4, N/A, 0.8
![Circle Property]() PC Rate 2021, 2020, 20197.0, N/A, 15.2
PC Rate 2021, 2020, 20197.0, N/A, 15.2
-
Population11,871
-
Median Income$82,289
-
VC Rate 2021, 2020, 20190.3, N/A, 0.8
![Circle Property]() PC Rate 2021, 2020, 20197.5, N/A, 8.3
PC Rate 2021, 2020, 20197.5, N/A, 8.3
-
Population24,255
-
Median Income$87,433
-
VC Rate 2021, 2020, 20190.6, N/A, 1.5
![Circle Property]() PC Rate 2021, 2020, 20197.6, N/A, 11.7
PC Rate 2021, 2020, 20197.6, N/A, 11.7
-
Population44,541
-
Median Income$89,569
-
VC Rate 2021, 2020, 20190.6, N/A, 2.6
![Circle Property]() PC Rate 2021, 2020, 201910.2, N/A, 12.3
PC Rate 2021, 2020, 201910.2, N/A, 12.3
-
Population7,334
-
Median Income$37,852
-
VC Rate 2021, 2020, 20191.1, N/A, 1.9
![Circle Property]() PC Rate 2021, 2020, 20199.7, N/A, 21.4
PC Rate 2021, 2020, 20199.7, N/A, 21.4
-
Population7,529
-
Median Income$57,188
-
VC Rate 2021, 2020, 20191.2, N/A, 0.5
![Circle Property]() PC Rate 2021, 2020, 20199.8, N/A, 10.7
PC Rate 2021, 2020, 20199.8, N/A, 10.7
-
Population10,334
-
Median Income$64,770
-
VC Rate 2021, 2020, 20191.0, N/A, 1.9
![Circle Property]() PC Rate 2021, 2020, 201912.4, N/A, 13.2
PC Rate 2021, 2020, 201912.4, N/A, 13.2

-
Population11,008
-
Median Income$45,838
-
VC Rate 2021, 2020, 20190.6, N/A, 1.3
![Circle Property]() PC Rate 2021, 2020, 201916.6, N/A, 20.7
PC Rate 2021, 2020, 201916.6, N/A, 20.7
-
Population22,708
-
Median Income$98,552
-
VC Rate 2021, 2020, 20191.3, N/A, 1.5
![Circle Property]() PC Rate 2021, 2020, 201912.0, N/A, 11.1
PC Rate 2021, 2020, 201912.0, N/A, 11.1
-
Population36,972
-
Median Income$78,676
-
VC Rate 2021, 2020, 20191.2, N/A, 1.5
![Circle Property]() PC Rate 2021, 2020, 201912.8, N/A, 18.0
PC Rate 2021, 2020, 201912.8, N/A, 18.0

-
Population8,415
-
Median Income$53,074
-
VC Rate 2021, 2020, 20192.3, N/A, 1.8
![Circle Property]() PC Rate 2021, 2020, 20196.9, N/A, 7.8
PC Rate 2021, 2020, 20196.9, N/A, 7.8

-
Population9,775
-
Median Income$47,692
-
VC Rate 2021, 2020, 20190.9, N/A, 0.2
![Circle Property]() PC Rate 2021, 2020, 201917.9, N/A, 16.9
PC Rate 2021, 2020, 201917.9, N/A, 16.9

-
Population40,612
-
Median Income$69,496
-
VC Rate 2021, 2020, 20191.7, N/A, 1.7
![Circle Property]() PC Rate 2021, 2020, 201912.8, N/A, 16.0
PC Rate 2021, 2020, 201912.8, N/A, 16.0
-
Population8,749
-
Median Income$50,346
-
VC Rate 2021, 2020, 20191.4, N/A, 1.6
![Circle Property]() PC Rate 2021, 2020, 201917.7, N/A, 25.3
PC Rate 2021, 2020, 201917.7, N/A, 25.3

-
Population23,823
-
Median Income$52,030
-
VC Rate 2021, 2020, 20192.0, N/A, 8.1
![Circle Property]() PC Rate 2021, 2020, 201913.4, N/A, 20.0
PC Rate 2021, 2020, 201913.4, N/A, 20.0

-
Population57,973
-
Median Income$52,298
-
VC Rate 2021, 2020, 20191.9, N/A, 2.8
![Circle Property]() PC Rate 2021, 2020, 201916.4, N/A, 27.4
PC Rate 2021, 2020, 201916.4, N/A, 27.4
-
Population20,086
-
Median Income$81,978
-
VC Rate 2021, 2020, 20193.5, N/A, 2.9
![Circle Property]() PC Rate 2021, 2020, 20196.0, N/A, 9.7
PC Rate 2021, 2020, 20196.0, N/A, 9.7

-
Population68,237
-
Median Income$46,127
-
VC Rate 2021, 2020, 20192.0, N/A, 1.8
![Circle Property]() PC Rate 2021, 2020, 201917.2, N/A, 20.6
PC Rate 2021, 2020, 201917.2, N/A, 20.6
How we determined the safest cities
Learn how we identified the safest cities on our methodology page.
How to make a safe home anywhere
Whether your city made our list or not, we encourage everyone to be proactive about home security. Learn more about your home security options—and find out which companies we recommend for every budget and lifestyle in our roundup of the Best Home Security Systems.
Didn't find your city in the top 20?
We calculated crime rates for every city in the state that met our population threshold, based on the state’s median population. See how the remaining cities ranked in the list below.
NOTE: If you don’t see your city on the list, it means that it was below the population threshold or didn’t submit a complete crime report to the FBI in 2019.
|
2021 Rank
|
City
|
Population
|
VC per 1,000
 |
PC per 1,000
|
|---|---|---|---|---|
| 21 | Iowa City | 77.39K | 2.2 | 16.2 |
| 22 | Perry | 7.42K | 2.7 | 12.3 |
| 23 | Boone | 12.45K | 2.9 | 11.3 |
| 24 | Le Mars | 10.02K | 2.4 | 16.6 |
| 25 | Webster City | 7.68K | 4.2 | 10.9 |
| 26 | Hiawatha | 7.44K | 3.8 | 15.2 |
| 27 | Nevada | 6.74K | 4.2 | 12.6 |
| 28 | Storm Lake | 10.43K | 3.9 | 16.2 |
| 29 | Creston | 7.78K | 3.3 | 21.1 |
| 30 | Clear Lake | 7.56K | 4.1 | 17.5 |
| 31 | Grinnell | 9.33K | 4.2 | 17.9 |
| 32 | Cedar Rapids | 134.01K | 2.6 | 33.4 |
| 33 | Oskaloosa | 11.42K | 4.7 | 17.9 |
| 34 | Atlantic | 6.51K | 3.4 | 27.9 |
| 35 | Marshalltown | 27.0K | 3.9 | 25.0 |
| 36 | Coralville | 22.04K | 3.1 | 31.3 |
| 37 | Waterloo | 67.72K | 4.5 | 24.8 |
| 38 | Clinton | 24.98K | 3.1 | 36.5 |
| 39 | Fort Dodge | 23.97K | 4.2 | 30.2 |
| 40 | Washington | 7.32K | 6.6 | 18.0 |
| 41 | Fort Madison | 10.39K | 6.6 | 19.7 |
| 42 | Indianola | 16.24K | 7.1 | 19.5 |
| 43 | Sioux City | 82.34K | 4.4 | 38.9 |
| 44 | Mason City | 26.98K | 6.5 | 29.2 |
| 45 | Ottumwa | 24.49K | 5.5 | 41.2 |
| 46 | Davenport | 102.39K | 5.9 | 38.3 |
| 47 | Des Moines | 218.38K | 7.1 | 40.9 |
| 48 | Council Bluffs | 62.43K | 7.9 | 58.5 |
Find the safest cities in each state
Click on the state image or dropdown menu below to check out the safest cities for each state.
Related articles on SafeWise
Sources
FBI: Uniform Crime Reporting Program, “2019 Crime in the United States,” Accessed March 15, 2021.
US Census Bureau, "Data Explorer," Accessed November 18, 2020.
Best Places, “Find a Place Search Tool,” Accessed January 6, 2021.
SafeWise, “2021 State of Safety survey,” Accessed March 15, 2021.
Gun Violence Archive, “Past Summary Ledgers,” Accessed January 6, 2021.
Gun Violence Archive, “General Methodology,” Accessed March 15, 2021.
Melody Hicks, Ben Stickle, Joshua Harms, American Journal of Criminal Justice, “Assessing the Fear of Package Theft,” January 04, 2021. Accessed March 15, 2021.
For definitions and more on data sources, see our methodology page.


The post Iowa’s 20 Safest Cities of 2021 appeared first on SafeWise.
Article source here: Iowa’s 20 Safest Cities of 2021