Missouri’s 20 Safest Cities of 2021

The SafeWise Team is pleased to release the seventh annual Safest Cities report.

Here are the 10 Safest Cities in Missouri for 2021
1. Clever
2. Vandalia
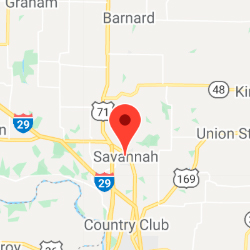
3. Savannah
4. Oronogo
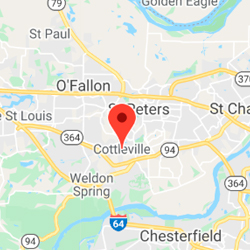
5. Cottleville
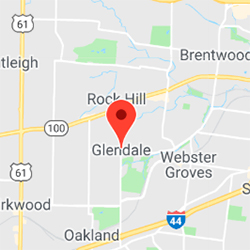
6. Glendale
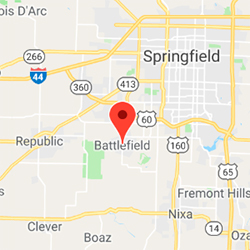
7. Battlefield
8. Higginsville
9. Pleasant Valley
10. Kearney
See if your city made the full list.
In our 2021 State of Safety survey, people in Missouri worried about their safety on a daily basis (46%) almost as much as most Americans (47%)—even with higher crime rates than most states. This is a big increase since last year's survey, when 37% of Missourians had daily concerns about personal safety.
Missouri's crime rates made an almost-imperceptible dip since last year. But The Show Me State's safest cities have lower-than-average crime rates compared to the state, region, and country.
2021 Missouri crime rates
While crime rates in Missouri didn't go down as much as in previous years, the state still saw some improvement. The violent crime rate went down from 5.0 per 1,000 people to 4.9 and the property crime rate decreased from 26.5 per 1,000 to 26.4. Missouri had the highest crime rates in the West North Central region for both violent crime and property crime.
Overall, Missouri has higher crime rates than most of the US. Among all 50 states, Missouri had the eighth-highest violent crime rate and the twelfth-highest property crime rate.

Level of concern and experience with crime in Missouri
Survey respondents in Missouri worried more frequently about their safety than last year—bringing the state just below the national average. And Missourians reported more personal experiences with property crime and gun violence than the previous year, though experiences with violent crime went down.

Crime concerns in Missouri
We asked Missouri residents which crimes they worry may happen to them. See if Missouri residents are concerned about the same crime issues as the rest of the country.

View the complete 2021 State of Safety report.
Violent crime in Missouri: Fear vs. reality
Survey responses in Missouri reflect the state's above-average violent crime rate with fewer than half of residents feeling safe in the state. Higher percentages of personal experiences with gun violence could play a role in this mentality. Still, the slight decrease in violent crimes overall is a positive trend for The Show Me State.
- 46% of survey respondents in Missouri reported feeling safe in their state compared to 55% of Americans.
- 12% of Missourians reported having a personal experience with violent crime in the past 12 months—down from 13% last year.
- Murder is an uncommon violent crime in The Show Me State, making up 2% of violent crimes (US 1%)—the state's 20 safest cities averaged 1%.
- Rape makes up 10% of violent crimes in Missouri (US 8%) but the 20 safest cities come in with a slightly higher number of incidents at 14%.
- 31% of survey participants report using some form of personal protection—making Missourians less likely to do this than the national average of 34%.
- 40% of Missouri residents say their personal safety has been affected by the COVID-19 pandemic compared to 44% of Americans.
Attitudes about police and gun violence in Missouri
- 64% of Missouri residents cited gun violence as a top safety concern—much higher than the US average of 53%.
- 11% of survey participants reported an experience with gun violence in the last 12 months, an increase from last year.
- There were 18 mass shootings in Missouri in 2019 and 22 in 2020.
- 48% of Missouri residents worry about police violence daily—more than the US average of 40%.
- 53% of Missourians reported having confidence in law enforcement. This is close to the US average of 56%.
- There were 94 officer-involved shootings in 2020, a 29% increase from 73 in 2019.

Property crime in Missouri: Fear vs. reality
Missouri has one of the higher property crime rates in the country this year, which could be a factor in surveyed residents reporting an increase in personal experiences with property crime. On the whole, the state saw slightly fewer property crimes per 1,000 people year over year.
- Compared to last year (22%), a greater number of Missourians reported personal experiences with property crime this year (26%).
- Burglary accounts for 16.3% of all property crimes in The Show Me State (the 20 safest cities average 9.4%), which is similar to the national rate of 16.1%.
- 18% of participants reported experiencing package theft in the last 12 months, putting Missouri below the US average of 20%.
- 51% of Missouri residents surveyed use some form of property protection. This is below the 62% national average.
- The top form of property protection in Missouri this year was home security systems with 25% of survey respondents using them. This matches the US national average.
- 26% of Missourians say the COVID-19 pandemic has affected the security of their property—this is lower than the US average of 29%.

A closer look at the safest cities in Missouri
For the purposes of this report, the terms “dangerous” and “safest” refer explicitly to crime rates as calculated from FBI crime data—no other characterization of any community is implied or intended.
- Missouri's safest city this year is Clever, which moved up 5 ranks from last year—it reported the lowest property crime rate in the state at 4.3 per 1,000 people.
- 16 (80%) increased in rank this year, with Montgomery City (up 63 spots) and Oronogo (up 59 spots) making the biggest leaps.
- 13 cities are new to the top 20 this year, including O'Fallon, the only city in the list with over 89,000 people—that's over 4 times the population of the next largest city, Nixa.
- Fayette saw the biggest drop in ranking among the 6 cities that stayed in the top 20 from last year, moving down 10 spots while last year's top city, Battlefield, dropped 6 places.
- Battlefield and Montgomery City each reported zero violent crimes this year.
- 75% of the safest cities reported violent crimes using single digits this year with 95% reporting fewer than 30 violent crimes total.
- There were 3 reported murders among the safest cities.
- 65% of the safest cities reported fewer than 100 total property crime incidents.

The 20 Safest Cities in Missouri

 Population2,787
 Median Income$49,485
 VC Rate 2021, 2020, 20190.7, 0.7, 1.5
![Circle Property]() PC Rate 2021, 2020, 20194.3, 6.2, 5.2
PC Rate 2021, 2020, 20194.3, 6.2, 5.2

-
Population4,072
-
Median Income$36,406
-
VC Rate 2021, 2020, 20190.2, 1.7, 1.6
![Circle Property]() PC Rate 2021, 2020, 20197.4, 8.1, 6.4
PC Rate 2021, 2020, 20197.4, 8.1, 6.4
-
Population5,212
-
Median Income$45,461
-
VC Rate 2021, 2020, 20190.2, 1.2, 0.8
![Circle Property]() PC Rate 2021, 2020, 20198.3, 11.0, 11.5
PC Rate 2021, 2020, 20198.3, 11.0, 11.5

-
Population2,694
-
Median Income$73,261
-
VC Rate 2021, 2020, 20190.4, 3.5, 1.6
![Circle Property]() PC Rate 2021, 2020, 20198.2, 10.5, 5.2
PC Rate 2021, 2020, 20198.2, 10.5, 5.2
-
Population5,849
-
Median Income$106,321
-
VC Rate 2021, 2020, 20190.9, 0.9, 1.2
![Circle Property]() PC Rate 2021, 2020, 20196.2, 2.6, 4.8
PC Rate 2021, 2020, 20196.2, 2.6, 4.8
-
Population5,873
-
Median Income$141,217
-
VC Rate 2021, 2020, 20190.2, 0.5, 0.5
![Circle Property]() PC Rate 2021, 2020, 20199.7, 5.4, 8.3
PC Rate 2021, 2020, 20199.7, 5.4, 8.3
-
Population6,348
-
Median Income$58,819
-
VC Rate 2021, 2020, 20190.0, 0.2, 0.3
![Circle Property]() PC Rate 2021, 2020, 201911.3, 6.6, 20.2
PC Rate 2021, 2020, 201911.3, 6.6, 20.2
-
Population4,588
-
Median Income$47,851
-
VC Rate 2021, 2020, 20190.7, 0.7, 1.1
![Circle Property]() PC Rate 2021, 2020, 20199.6, 12.6, 11.9
PC Rate 2021, 2020, 20199.6, 12.6, 11.9

-
Population3,073
-
Median Income$57,019
-
VC Rate 2021, 2020, 20190.3, 1.6, 2.6
![Circle Property]() PC Rate 2021, 2020, 201911.4, 10.1, 11.7
PC Rate 2021, 2020, 201911.4, 10.1, 11.7

-
Population10,736
-
Median Income$78,152
-
VC Rate 2021, 2020, 20190.7, 0.6, 1.1
![Circle Property]() PC Rate 2021, 2020, 201910.2, 14.5, 15.3
PC Rate 2021, 2020, 201910.2, 14.5, 15.3

-
Population2,647
-
Median Income$39,632
-
VC Rate 2021, 2020, 20190.0, 1.5, 3.3
![Circle Property]() PC Rate 2021, 2020, 201913.6, 25.1, 23.8
PC Rate 2021, 2020, 201913.6, 25.1, 23.8
-
Population11,643
-
Median Income$34,308
-
VC Rate 2021, 2020, 20190.7, 0.6, 2.0
![Circle Property]() PC Rate 2021, 2020, 201911.2, 14.4, 12.8
PC Rate 2021, 2020, 201911.2, 14.4, 12.8
-
Population22,235
-
Median Income$53,674
-
VC Rate 2021, 2020, 20191.3, 1.2, 1.0
![Circle Property]() PC Rate 2021, 2020, 20199.4, 11.5, 14.4
PC Rate 2021, 2020, 20199.4, 11.5, 14.4
-
Population5,190
-
Median Income$52,642
-
VC Rate 2021, 2020, 20191.7, 1.5, N/A
![Circle Property]() PC Rate 2021, 2020, 20198.3, 13.1, N/A
PC Rate 2021, 2020, 20198.3, 13.1, N/A

-
Population22,121
-
Median Income$81,603
-
VC Rate 2021, 2020, 20190.8, 0.4, 0.7
![Circle Property]() PC Rate 2021, 2020, 201913.2, 22.1, 21.5
PC Rate 2021, 2020, 201913.2, 22.1, 21.5
-
Population16,936
-
Median Income$97,145
-
VC Rate 2021, 2020, 20190.7, 1.5, 1.2
![Circle Property]() PC Rate 2021, 2020, 201913.8, 15.6, 15.3
PC Rate 2021, 2020, 201913.8, 15.6, 15.3
-
Population10,503
-
Median Income$79,038
-
VC Rate 2021, 2020, 20191.4, 1.0, 0.9
![Circle Property]() PC Rate 2021, 2020, 201910.4, 15.3, 13.0
PC Rate 2021, 2020, 201910.4, 15.3, 13.0
-
Population89,611
-
Median Income$87,238
-
VC Rate 2021, 2020, 20191.3, 1.6, 1.8
![Circle Property]() PC Rate 2021, 2020, 201911.3, 10.7, 11.5
PC Rate 2021, 2020, 201911.3, 10.7, 11.5

-
Population2,719
-
Median Income$43,879
-
VC Rate 2021, 2020, 20192.2, 0.7, 0.4
![Circle Property]() PC Rate 2021, 2020, 20197.0, 9.2, 14.5
PC Rate 2021, 2020, 20197.0, 9.2, 14.5

-
Population3,065
-
Median Income$30,211
-
VC Rate 2021, 2020, 20190.3, 0.6, 0.3
![Circle Property]() PC Rate 2021, 2020, 201916.6, 23.5, 14.2
PC Rate 2021, 2020, 201916.6, 23.5, 14.2
How we determined the safest cities
Learn how we identified the safest cities on our methodology page.
How to make a safe home anywhere
Whether your city made our list or not, we encourage everyone to be proactive about home security. Learn more about your home security options—and find out which companies we recommend for every budget and lifestyle in our roundup of the Best Home Security Systems.
Didn't find your city in the top 20?
We calculated crime rates for every city in the state that met our population threshold, based on the state’s median population. See how the remaining cities ranked in the list below.
NOTE: If you don’t see your city on the list, it means that it was below the population threshold or didn’t submit a complete crime report to the FBI in 2019.
|
2021 Rank
|
City
|
Population
|
VC per 1,000
 |
PC per 1,000
|
|---|---|---|---|---|
| 21 | Platte City | 5,002 | 1.4 | 11.6 |
| 22 | Ashland | 3,975 | 0.8 | 14.8 |
| 23 | Hollister | 4,608 | 1.5 | 11.1 |
| 24 | Rogersville | 3,888 | 1.0 | 13.9 |
| 25 | Creve Coeur | 18,829 | 0.7 | 15.3 |
| 26 | Ellisville | 9,946 | 1.4 | 12.4 |
| 27 | Willard | 5,616 | 1.2 | 13.2 |
| 28 | Rock Hill | 4,620 | 1.3 | 13.6 |
| 29 | Ste. Genevieve | 4,445 | 2.0 | 10.1 |
| 30 | Jackson | 15,151 | 1.1 | 15.0 |
| 31 | Moscow Mills | 3,298 | 1.2 | 14.6 |
| 32 | Wentzville | 42,892 | 2.1 | 10.5 |
| 33 | Licking | 3,087 | 2.6 | 8.1 |
| 34 | Ladue | 8,650 | 0.9 | 16.5 |
| 35 | Grain Valley | 14,464 | 1.5 | 14.4 |
| 36 | Parkville | 7,143 | 0.8 | 18.6 |
| 37 | Lake St. Louis | 16,444 | 1.3 | 16.2 |
| 38 | De Soto | 6,355 | 0.9 | 18.6 |
| 39 | Salem | 4,895 | 1.2 | 18.4 |
| 40 | Peculiar | 5,417 | 1.3 | 18.3 |
| 41 | Republic | 16,715 | 1.9 | 16.6 |
| 42 | Lee's Summit | 99,365 | 1.2 | 21.1 |
| 43 | Pacific | 7,265 | 0.6 | 24.2 |
| 44 | Oak Grove | 8,226 | 2.1 | 16.8 |
| 45 | Sunset Hills | 8,480 | 1.3 | 20.6 |
| 46 | Excelsior Springs | 11,715 | 1.3 | 21.6 |
| 47 | Mount Vernon | 4,504 | 0.0 | 29.3 |
| 48 | Ava | 2,902 | 2.8 | 16.2 |
| 49 | Blue Springs | 55,415 | 1.8 | 21.9 |
| 50 | Frontenac | 3,851 | 1.3 | 24.7 |
| 51 | Palmyra | 3,606 | 0.0 | 31.3 |
| 52 | Trenton | 5,779 | 2.4 | 19.7 |
| 53 | Boonville | 8,410 | 1.9 | 22.5 |
| 54 | St. Peters | 57,697 | 2.4 | 20.1 |
| 55 | Scott City | 4,493 | 2.4 | 20.0 |
| 56 | Buffalo | 3,073 | 0.7 | 30.3 |
| 57 | Dexter | 7,861 | 1.9 | 24.6 |
| 58 | Cameron | 9,674 | 3.3 | 17.8 |
| 59 | Herculaneum | 4,149 | 1.2 | 29.2 |
| 60 | Marshfield | 7,566 | 0.9 | 31.2 |
| 61 | Ozark | 20,490 | 2.9 | 22.3 |
| 62 | Arnold | 21,102 | 1.5 | 29.8 |
| 63 | Chillicothe | 9,700 | 3.2 | 22.4 |
| 64 | Mexico | 11,529 | 0.8 | 34.5 |
| 65 | Maryland Heights | 26,964 | 2.1 | 28.2 |
| 66 | Mountain Grove | 4,681 | 4.3 | 17.5 |
| 67 | Waynesville | 5,265 | 4.4 | 17.5 |
| 68 | Eldon | 4,649 | 3.0 | 24.3 |
| 69 | Jefferson City | 42,793 | 2.8 | 25.7 |
| 70 | Crystal City | 4,698 | 1.1 | 34.3 |
| 71 | Farmington | 19,178 | 1.4 | 33.4 |
| 72 | Columbia | 125,017 | 3.2 | 25.9 |
| 73 | Gladstone | 27,553 | 3.2 | 26.3 |
| 74 | Marshall | 12,915 | 4.6 | 20.4 |
| 75 | Park Hills | 8,484 | 4.2 | 22.5 |
| 76 | Portageville | 2,964 | 5.4 | 16.9 |
| 77 | Perryville | 8,466 | 3.3 | 27.3 |
| 78 | Neosho | 12,076 | 2.4 | 32.6 |
| 79 | Warrensburg | 20,435 | 2.9 | 30.1 |
| 80 | Belton | 23,657 | 2.8 | 30.9 |
| 81 | Louisiana | 3,241 | 3.7 | 27.2 |
| 82 | Carthage | 14,808 | 2.6 | 34.1 |
| 83 | Washington | 14,064 | 2.6 | 34.2 |
| 84 | Hillsboro | 3,231 | 5.3 | 21.4 |
| 85 | Hazelwood | 25,146 | 4.5 | 27.6 |
| 86 | Moberly | 13,559 | 6.1 | 20.3 |
| 87 | Bolivar | 11,129 | 2.7 | 37.4 |
| 88 | Butler | 4,017 | 3.7 | 32.9 |
| 89 | Harrisonville | 10,095 | 2.8 | 39.1 |
| 90 | Charleston | 5,490 | 7.7 | 18.0 |
| 91 | Cape Girardeau | 40,077 | 5.8 | 35.7 |
| 92 | Rolla | 20,482 | 5.3 | 39.7 |
| 93 | Lebanon | 14,841 | 4.0 | 47.8 |
| 94 | Nevada | 8,237 | 2.5 | 56.0 |
| 95 | Camdenton | 4,138 | 4.3 | 48.1 |
| 96 | Sugar Creek | 3,269 | 7.3 | 33.6 |
| 97 | Sullivan | 7,111 | 5.8 | 45.4 |
| 98 | Aurora | 7,455 | 4.8 | 50.2 |
| 99 | Richmond | 5,615 | 7.5 | 37.4 |
| 100 | Independence | 116,931 | 5.9 | 46.5 |
| 101 | Grandview | 25,022 | 7.7 | 38.7 |
| 102 | West Plains | 12,284 | 4.2 | 57.7 |
| 103 | Raytown | 28,932 | 6.9 | 44.7 |
| 104 | Riverside | 3,522 | 4.3 | 61.9 |
| 105 | St. Robert | 6,034 | 3.5 | 67.3 |
| 106 | St. Joseph | 75,872 | 5.7 | 57.4 |
| 107 | Sedalia | 21,742 | 8.6 | 43.9 |
| 108 | Osage Beach | 4,598 | 5.4 | 61.5 |
| 109 | Maplewood | 8,108 | 3.2 | 73.3 |
| 110 | El Dorado Springs | 3,594 | 5.3 | 65.9 |
| 111 | Bellefontaine Neighbors | 10,416 | 11.9 | 34.0 |
| 112 | Berkeley | 8,868 | 10.3 | 42.5 |
| 113 | Potosi | 2,609 | 5.7 | 66.7 |
| 114 | Caruthersville | 5,451 | 11.9 | 40.5 |
| 115 | Cassville | 3,327 | 4.5 | 79.7 |
| 116 | Joplin | 50,635 | 6.1 | 72.6 |
| 117 | Kansas City | 495,964 | 14.3 | 38.6 |
| 118 | North Kansas City | 4,573 | 6.3 | 82.4 |
| 119 | Riverview | 2,836 | 17.6 | 33.9 |
| 120 | Pagedale | 3,293 | 19.4 | 30.1 |
| 121 | Vinita Park | 10,979 | 14.5 | 54.6 |
| 122 | Branson | 11,688 | 6.2 | 100.4 |
| 123 | Springfield | 169,235 | 15.2 | 77.9 |
| 124 | St. Louis | 300,521 | 19.3 | 61.8 |
Find the safest cities in each state
Click on the state image or dropdown menu below to check out the safest cities for each state.
Related articles on SafeWise
Sources
FBI: Uniform Crime Reporting Program, “2019 Crime in the United States,” Accessed March 15, 2021.
US Census Bureau, "Data Explorer," Accessed November 18, 2020.
Best Places, “Find a Place Search Tool,” Accessed January 6, 2021.
SafeWise, “2021 State of Safety survey,” Accessed March 15, 2021.
Gun Violence Archive, “Past Summary Ledgers,” Accessed January 6, 2021.
Gun Violence Archive, “General Methodology,” Accessed March 15, 2021.
Melody Hicks, Ben Stickle, Joshua Harms, American Journal of Criminal Justice, “Assessing the Fear of Package Theft,” January 04, 2021. Accessed March 15, 2021.
For definitions and more on data sources, see our methodology page.


The post Missouri’s 20 Safest Cities of 2021 appeared first on SafeWise.
Article source here: Missouri’s 20 Safest Cities of 2021