New Jersey’s 50 Safest Cities of 2021

The SafeWise Team is pleased to release the seventh annual Safest Cities report.

Here are the 10 safest cities in New Jersey for 2021
1. River Vale Township
2. Sparta Township
3. Chatham Township
4. Kinnelon
5. New Providence
6. Warren Township
7. Clinton Township
8. Bernards Township
9. Monroe Township, Middlesex County
10. Wanaque
See if your city made the full list.
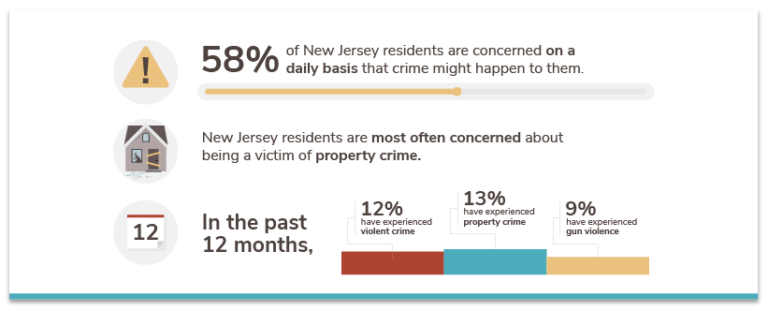
In our 2021 State of Safety survey, 58% of residents in New Jersey expressed daily levels of high concern for their safety, which is a big jump over last year, when just 44% of respondents had similar concerns. By comparison, less than half of Americans (47%) reported similar levels of concern.
Survey participants in New Jersey reported having twice as many personal experiences with violent crime this year compared to last year—experience with gun violence nearly doubled as well.
Still, The Garden State is close to the national average and even saw some improvements like fewer experiences with property crime and a lower property crime rate. All of New Jersey's 50 safest cities reported crime rates well below the state and national average.
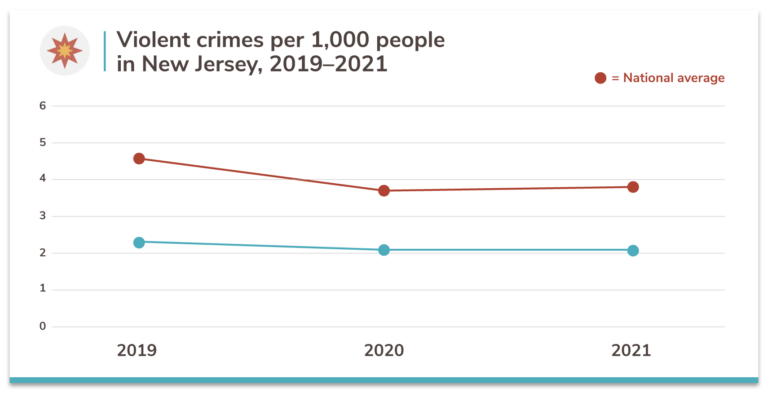
2021 New Jersey crime rates
New Jersey's violent crime rate made an almost imperceptible improvement compared to last year—while the overall rate stayed at 2.1 incidents per 1,000 people, there were 162 fewer violent crimes. The state also saw fewer property crimes with the property crime rate dropping from 14.0 per 1,000 people to 13.4.
In the Mid-Atlantic region, New Jersey bested the regional average and had the lowest violent crime rate ahead of Pennsylvania (3.1). It also had the lowest property crime rate ahead of New York (13.7).
New Jersey's crime rates are also lower than the national average. Among all 50 states, New Jersey had the fifth-lowest rate for both violent crime and property crime.

Level of concern and experience with crime in New Jersey
Compared to last year, New Jerseyites were 1.3 times more likely to worry about their safety on a daily basis. This jump in levels of concern puts New Jersey above the national average for the first time in two years. Survey participants also reported a twofold increase in personal experiences with violent crime while experiences with gun violence were 1.8 times more common.
Experiences with property crime went down compared to our last survey but didn't reach the low levels from two years ago.
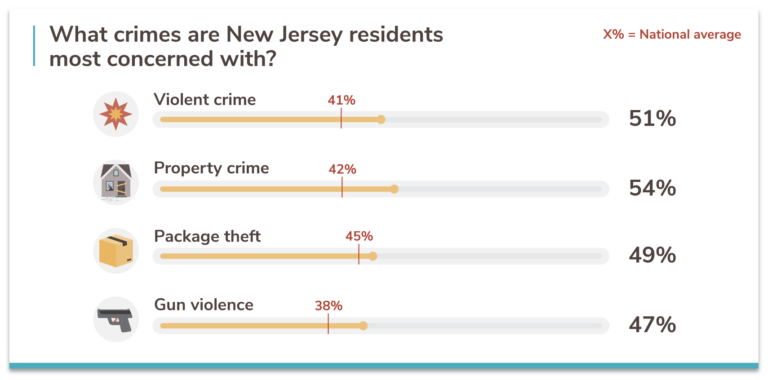
Crime concerns in New Jersey
We asked New Jersey residents which crimes they worry may happen to them. See if New Jersey residents are concerned about the same crime issues as the rest of the country.
View the complete 2021 State of Safety report.
Violent crime in New Jersey: Fear vs. reality
Just over half of New Jersey residents feel safe in their home state, which is close to how most Americans feel. Despite a small decrease in violent crimes, respondents reported more experiences with violent crime compared to last year. People in New Jersey were also more likely than average to say the COVID-19 pandemic has affected their personal safety.
- 52% of people in New Jersey reported feeling safe in their state compared to 55% of Americans.
- Twice as many people in New Jersey (12%) reported having a personal experience with violent crime in the last 12 months—up from 6% last year.
- Murder is the least common violent crime in The Garden State, making up 1% of violent crimes (US 1%)—the state's 20 safest cities averaged 0.7%.
- Rape makes up 8% of violent crimes in New Jersey (US 8%) but the 50 safest cities have a higher number of instances at 15%.
- 35% of survey participants report using some form of personal protection like pepper spray—slightly higher than the US average (34%).
- 55% of New Jerseyites say their personal safety has been affected by the COVID-19 pandemic compared to 44% of Americans—only 3 states reported higher numbers.
Attitudes about police and gun violence in New Jersey
- 67% of New Jersey residents named gun violence as a top safety concern—well above the US average of 53%.
- 9% of survey participants reported experiencing gun violence in the last 12 months, a near-doubling from 5% last year.
- There were 11 mass shootings in New Jersey in 2019 and 12 in 2020.
- 49% of New Jerseyans worry about police violence daily—higher than the US average of 40%—the state ranks seventh nationally for its worry.
- Despite concerns over police violence, 59% of New Jersey residents reported having confidence in law enforcement—close to the US average of 56%.
- There were 16 officer-involved shootings in 2020, a 48% decrease from 31 in 2019.
Property crime in New Jersey: Fear vs. reality
People in New Jersey reported less personal experience with property crime this year, which matches a similar decline in the state's property crime rate. Residents were more likely than average to use a security system or to say their property was affected by the COVID-19 pandemic.
- Fewer New Jerseyans (13%) reported personal experiences with property crime this year compared to last year (15%).
- Burglary accounts for 14% of all property crimes in The Garden State (the 50 safest cities average 15%), which is lower than the national rate of 16%.
- 21% of participants reported experiencing package theft, putting New Jersey just above the US average of 20%.
- 55% of people in New Jersey use some form of property protection. This is below the 62% national average.
- The top form of property protection in New Jersey this year was security systems with 31% of survey respondents using them. This is higher than the national average of 25%.
- 40% of respondents say the COVID-19 pandemic has affected the security of their property—this is higher than the US average of 29%.

A closer look at the safest cities in New Jersey
For the purposes of this report, the terms “dangerous” and “safest” refer explicitly to crime rates as calculated from FBI crime data—no other characterization of any community is implied or intended.
- River Vale Township is the top city for the second year in a row.
- 80% of the top cities from last year stayed in the top 50 this year with 27 increasing in rank year over year.
- Wanaque had the biggest jump in ranking from last year—it moved up 66 spots from 76 to 10.
- 98% of the safest cities have a population over 10,000—only Kinnelon (population 9,984) was smaller.
- Mount Olive Township had the biggest drop among cities that remained in the top 50 from last year. It moved down 30 spots from 4 to 34.
- Last year, 10 of the 50 safest cities reported 0 violent crimes—this year, 6 cities had 0 violent crimes—River Vale Township, Chatham Township, New Providence, Warren Township, Bernards Township, and Glen Rock.
- Unusually, 3 cities outside of the top 50 had zero reports of violent crime—Westwood (57), Hawthorne (66), and East Greenwich Township (90).
- Chatham Township and New Providence have had no reports of violent crimes in the last 3 years. Glen Rock hasn't reported a violent crime in 2 years.
- There were 2 murders and 40 rapes reported among the 50 safest cities, which is unusually low for a state with 50 qualifying cities, let alone 49 with populations above 10,000 people.
- New Jersey's top 75 safest cities have violent crime rates under 1.0 per 1,000 people.
- Each of the top 50 cities reported fewer than 20 violent crime incidents this year while 82% reported less than 10 violent crimes.
- Sparta Township had the lowest property crime rate in the state this year (1.7).
- 82% of the safest cities reported fewer than 100 total property crimes this year—River Vale Township tallied the fewest incidents at 20.

The 50 Safest Cities in New Jersey

 Population10,063
 Median Income$131,764
 VC Rate 2021, 2020, 20190.0, 0.1, 0.1
![Circle Property]() PC Rate 2021, 2020, 20192.0, 2.4, 1.5
PC Rate 2021, 2020, 20192.0, 2.4, 1.5
-
Population18,532
-
Median Income$126,090
-
VC Rate 2021, 2020, 20190.2, 0.3, 0.5
![Circle Property]() PC Rate 2021, 2020, 20191.7, 2.9, 3.5
PC Rate 2021, 2020, 20191.7, 2.9, 3.5
-
Population10,219
-
Median Income$135,497
-
VC Rate 2021, 2020, 20190.0, 0.0, 0.0
![Circle Property]() PC Rate 2021, 2020, 20192.3, 3.2, 3.7
PC Rate 2021, 2020, 20192.3, 3.2, 3.7

-
Population9,984
-
Median Income$125,000
-
VC Rate 2021, 2020, 20190.1, 0.1, 0.5
![Circle Property]() PC Rate 2021, 2020, 20192.2, 2.5, 3.4
PC Rate 2021, 2020, 20192.2, 2.5, 3.4
-
Population13,592
-
Median Income$139,071
-
VC Rate 2021, 2020, 20190.0, 0.0, 0.0
![Circle Property]() PC Rate 2021, 2020, 20192.6, 4.9, 4.5
PC Rate 2021, 2020, 20192.6, 4.9, 4.5
-
Population15,772
-
Median Income$144,233
-
VC Rate 2021, 2020, 20190.0, 0.2, 0.2
![Circle Property]() PC Rate 2021, 2020, 20192.7, 3.3, 2.6
PC Rate 2021, 2020, 20192.7, 3.3, 2.6
-
Population12,801
-
Median Income$101,923
-
VC Rate 2021, 2020, 20190.2, 0.1, 0.1
![Circle Property]() PC Rate 2021, 2020, 20192.6, 3.9, 5.6
PC Rate 2021, 2020, 20192.6, 3.9, 5.6
-
Population27,228
-
Median Income$126,667
-
VC Rate 2021, 2020, 20190.0, 0.1, 0.0
![Circle Property]() PC Rate 2021, 2020, 20193.0, 3.2, 4.3
PC Rate 2021, 2020, 20193.0, 3.2, 4.3

-
Population45,342
-
Median Income$70,772
-
VC Rate 2021, 2020, 20190.4, 0.1, 0.1
![Circle Property]() PC Rate 2021, 2020, 20192.6, 3.5, 3.4
PC Rate 2021, 2020, 20192.6, 3.5, 3.4

-
Population11,772
-
Median Income$85,373
-
VC Rate 2021, 2020, 20190.3, 0.9, 0.5
![Circle Property]() PC Rate 2021, 2020, 20192.9, 5.9, 6.7
PC Rate 2021, 2020, 20192.9, 5.9, 6.7
-
Population14,635
-
Median Income$114,593
-
VC Rate 2021, 2020, 20190.1, 0.1, 0.1
![Circle Property]() PC Rate 2021, 2020, 20193.5, 4.0, 5.7
PC Rate 2021, 2020, 20193.5, 4.0, 5.7

-
Population13,355
-
Median Income$100,503
-
VC Rate 2021, 2020, 20190.1, 0.0, 0.3
![Circle Property]() PC Rate 2021, 2020, 20193.7, 6.6, 5.6
PC Rate 2021, 2020, 20193.7, 6.6, 5.6

-
Population22,220
-
Median Income$113,214
-
VC Rate 2021, 2020, 20190.4, 0.2, 0.2
![Circle Property]() PC Rate 2021, 2020, 20192.9, 4.3, 4.2
PC Rate 2021, 2020, 20192.9, 4.3, 4.2
-
Population17,649
-
Median Income$91,811
-
VC Rate 2021, 2020, 20190.3, 0.3, 0.2
![Circle Property]() PC Rate 2021, 2020, 20193.1, 2.7, 4.9
PC Rate 2021, 2020, 20193.1, 2.7, 4.9

-
Population16,506
-
Median Income$75,071
-
VC Rate 2021, 2020, 20190.1, 0.3, 0.1
![Circle Property]() PC Rate 2021, 2020, 20193.9, 3.1, 4.4
PC Rate 2021, 2020, 20193.9, 3.1, 4.4
-
Population21,912
-
Median Income$87,707
-
VC Rate 2021, 2020, 20190.1, 0.0, 0.4
![Circle Property]() PC Rate 2021, 2020, 20193.7, 4.5, 8.6
PC Rate 2021, 2020, 20193.7, 4.5, 8.6

-
Population27,432
-
Median Income$80,365
-
VC Rate 2021, 2020, 20190.5, 0.0, 0.1
![Circle Property]() PC Rate 2021, 2020, 20192.7, 2.7, 3.7
PC Rate 2021, 2020, 20192.7, 2.7, 3.7
-
Population14,091
-
Median Income$85,357
-
VC Rate 2021, 2020, 20190.6, 0.4, 0.8
![Circle Property]() PC Rate 2021, 2020, 20192.8, 3.0, 5.0
PC Rate 2021, 2020, 20192.8, 3.0, 5.0
-
Population16,533
-
Median Income$109,737
-
VC Rate 2021, 2020, 20190.1, 0.2, 0.2
![Circle Property]() PC Rate 2021, 2020, 20194.2, 4.8, 4.1
PC Rate 2021, 2020, 20194.2, 4.8, 4.1

-
Population13,125
-
Median Income$127,875
-
VC Rate 2021, 2020, 20190.1, 0.2, 0.5
![Circle Property]() PC Rate 2021, 2020, 20194.3, 5.2, 7.8
PC Rate 2021, 2020, 20194.3, 5.2, 7.8

-
Population13,075
-
Median Income$117,571
-
VC Rate 2021, 2020, 20190.2, 0.0, 0.3
![Circle Property]() PC Rate 2021, 2020, 20194.1, 4.0, 5.2
PC Rate 2021, 2020, 20194.1, 4.0, 5.2

-
Population12,165
-
Median Income$106,880
-
VC Rate 2021, 2020, 20190.4, 0.5, 0.2
![Circle Property]() PC Rate 2021, 2020, 20193.5, 3.9, 3.0
PC Rate 2021, 2020, 20193.5, 3.9, 3.0

-
Population25,490
-
Median Income$117,560
-
VC Rate 2021, 2020, 20190.3, 0.1, 0.2
![Circle Property]() PC Rate 2021, 2020, 20193.9, 5.0, 4.5
PC Rate 2021, 2020, 20193.9, 5.0, 4.5
-
Population20,877
-
Median Income$96,298
-
VC Rate 2021, 2020, 20190.5, 0.2, 0.3
![Circle Property]() PC Rate 2021, 2020, 20193.4, 4.0, 4.3
PC Rate 2021, 2020, 20193.4, 4.0, 4.3
-
Population22,755
-
Median Income$104,453
-
VC Rate 2021, 2020, 20190.1, 0.0, 0.2
![Circle Property]() PC Rate 2021, 2020, 20194.4, 5.5, 10.1
PC Rate 2021, 2020, 20194.4, 5.5, 10.1

-
Population10,382
-
Median Income$113,077
-
VC Rate 2021, 2020, 20190.2, 0.3, 0.0
![Circle Property]() PC Rate 2021, 2020, 20194.3, 3.9, 3.3
PC Rate 2021, 2020, 20194.3, 3.9, 3.3
-
Population16,590
-
Median Income$105,135
-
VC Rate 2021, 2020, 20190.4, 0.1, 0.1
![Circle Property]() PC Rate 2021, 2020, 20193.9, 5.4, 5.2
PC Rate 2021, 2020, 20193.9, 5.4, 5.2
-
Population10,162
-
Median Income$81,661
-
VC Rate 2021, 2020, 20190.2, 0.0, 0.4
![Circle Property]() PC Rate 2021, 2020, 20194.5, 5.8, 6.9
PC Rate 2021, 2020, 20194.5, 5.8, 6.9

-
Population11,803
-
Median Income$154,615
-
VC Rate 2021, 2020, 20190.0, 0.0, 0.2
![Circle Property]() PC Rate 2021, 2020, 20195.1, 4.1, 7.7
PC Rate 2021, 2020, 20195.1, 4.1, 7.7

-
Population13,592
-
Median Income$139,500
-
VC Rate 2021, 2020, 20190.3, 0.3, 0.2
![Circle Property]() PC Rate 2021, 2020, 20194.3, 4.4, 5.3
PC Rate 2021, 2020, 20194.3, 4.4, 5.3
-
Population29,688
-
Median Income$168,721
-
VC Rate 2021, 2020, 20190.1, 0.1, 0.1
![Circle Property]() PC Rate 2021, 2020, 20194.7, 7.2, 8.4
PC Rate 2021, 2020, 20194.7, 7.2, 8.4

-
Population12,992
-
Median Income$117,596
-
VC Rate 2021, 2020, 20190.4, 0.5, 0.6
![Circle Property]() PC Rate 2021, 2020, 20194.1, 3.7, 6.0
PC Rate 2021, 2020, 20194.1, 3.7, 6.0
-
Population17,854
-
Median Income$144,539
-
VC Rate 2021, 2020, 20190.4, 0.4, 0.4
![Circle Property]() PC Rate 2021, 2020, 20194.1, 4.2, 5.3
PC Rate 2021, 2020, 20194.1, 4.2, 5.3
-
Population29,025
-
Median Income$88,467
-
VC Rate 2021, 2020, 20190.5, 0.2, 0.3
![Circle Property]() PC Rate 2021, 2020, 20193.9, 2.7, 5.6
PC Rate 2021, 2020, 20193.9, 2.7, 5.6

-
Population26,317
-
Median Income$102,168
-
VC Rate 2021, 2020, 20190.3, 0.1, 0.3
![Circle Property]() PC Rate 2021, 2020, 20194.4, 3.7, 5.5
PC Rate 2021, 2020, 20194.4, 3.7, 5.5

-
Population13,659
-
Median Income$71,061
-
VC Rate 2021, 2020, 20190.4, 0.8, 0.6
![Circle Property]() PC Rate 2021, 2020, 20194.0, 7.3, 9.5
PC Rate 2021, 2020, 20194.0, 7.3, 9.5
-
Population23,364
-
Median Income$154,375
-
VC Rate 2021, 2020, 20190.2, 0.3, 0.3
![Circle Property]() PC Rate 2021, 2020, 20194.8, 4.1, 4.3
PC Rate 2021, 2020, 20194.8, 4.1, 4.3
-
Population22,080
-
Median IncomeNot available
-
VC Rate 2021, 2020, 20190.4, 0.3, 0.1
![Circle Property]() PC Rate 2021, 2020, 20194.3, 5.4, 4.5
PC Rate 2021, 2020, 20194.3, 5.4, 4.5

-
Population10,840
-
Median Income$101,083
-
VC Rate 2021, 2020, 20190.2, 0.2, 0.7
![Circle Property]() PC Rate 2021, 2020, 20195.0, 6.2, 6.0
PC Rate 2021, 2020, 20195.0, 6.2, 6.0

-
Population17,030
-
Median Income$141,964
-
VC Rate 2021, 2020, 20190.3, 0.3, 0.5
![Circle Property]() PC Rate 2021, 2020, 20194.8, 4.9, 6.2
PC Rate 2021, 2020, 20194.8, 4.9, 6.2
-
Population39,813
-
Median Income$115,200
-
VC Rate 2021, 2020, 20190.3, 0.4, 0.2
![Circle Property]() PC Rate 2021, 2020, 20194.8, 6.0, 6.3
PC Rate 2021, 2020, 20194.8, 6.0, 6.3

-
Population15,805
-
Median Income$121,210
-
VC Rate 2021, 2020, 20190.7, 0.1, 0.1
![Circle Property]() PC Rate 2021, 2020, 20193.9, 5.1, 5.0
PC Rate 2021, 2020, 20193.9, 5.1, 5.0

-
Population12,508
-
Median Income$103,384
-
VC Rate 2021, 2020, 20190.5, 0.3, 0.3
![Circle Property]() PC Rate 2021, 2020, 20194.5, 6.8, 7.4
PC Rate 2021, 2020, 20194.5, 6.8, 7.4
-
Population26,115
-
Median Income$56,171
-
VC Rate 2021, 2020, 20190.7, 0.6, 0.9
![Circle Property]() PC Rate 2021, 2020, 20193.9, 6.0, 7.2
PC Rate 2021, 2020, 20193.9, 6.0, 7.2

-
Population11,240
-
Median Income$69,466
-
VC Rate 2021, 2020, 20190.5, 0.3, 0.2
![Circle Property]() PC Rate 2021, 2020, 20194.4, 6.0, 6.4
PC Rate 2021, 2020, 20194.4, 6.0, 6.4
-
Population12,049
-
Median Income$87,705
-
VC Rate 2021, 2020, 20190.2, 0.1, 0.2
![Circle Property]() PC Rate 2021, 2020, 20195.2, 4.2, 5.0
PC Rate 2021, 2020, 20195.2, 4.2, 5.0

-
Population10,240
-
Median Income$106,750
-
VC Rate 2021, 2020, 20190.2, 0.2, 0.3
![Circle Property]() PC Rate 2021, 2020, 20195.6, 4.7, 6.3
PC Rate 2021, 2020, 20195.6, 4.7, 6.3
-
Population15,045
-
Median Income$89,435
-
VC Rate 2021, 2020, 20190.5, 0.2, 0.1
![Circle Property]() PC Rate 2021, 2020, 20194.9, 6.1, 6.2
PC Rate 2021, 2020, 20194.9, 6.1, 6.2
-
Population18,296
-
Median Income$125,149
-
VC Rate 2021, 2020, 20190.7, 0.4, 0.2
![Circle Property]() PC Rate 2021, 2020, 20194.4, 2.7, 2.2
PC Rate 2021, 2020, 20194.4, 2.7, 2.2
-
Population26,287
-
Median Income$96,773
-
VC Rate 2021, 2020, 20190.5, 0.4, 0.9
![Circle Property]() PC Rate 2021, 2020, 20194.8, 5.9, 7.6
PC Rate 2021, 2020, 20194.8, 5.9, 7.6
How we determined the safest cities
Learn how we identified the safest cities on our methodology page.
How to make a safe home anywhere
Whether your city made our list or not, we encourage everyone to be proactive about home security. Learn more about your home security options—and find out which companies we recommend for every budget and lifestyle in our roundup of the Best Home Security Systems.
Didn't find your city in the top 50?
We calculated crime rates for every city in the state that met our population threshold, based on the state’s median population. See how the remaining cities ranked in the list below.
NOTE: If you don’t see your city on the list, it means that it was below the population threshold or didn’t submit a complete crime report to the FBI in 2019.
|
2021 Rank
|
City
|
Population
|
VC per 1,000
 |
PC per 1,000
|
|---|---|---|---|---|
| 51 | Tenafly | 14.59K | 0.1 | 6.1 |
| 52 | Middletown Township | 65.36K | 0.3 | 5.4 |
| 53 | Branchburg Township | 14.55K | 0.3 | 5.7 |
| 54 | South Brunswick Township | 46.04K | 0.4 | 5.5 |
| 55 | Summit | 21.98K | 0.1 | 6.2 |
| 56 | Franklin Lakes | 11.11K | 0.5 | 5.3 |
| 57 | Westwood | 11.13K | 0.0 | 6.7 |
| 58 | Barnegat Township | 23.40K | 0.5 | 5.3 |
| 59 | River Edge | 11.50K | 0.2 | 6.3 |
| 60 | Manalapan Township | 39.66K | 0.5 | 5.7 |
| 61 | Colts Neck Township | 9.85K | 0.4 | 5.9 |
| 62 | Ridgewood | 25.19K | 0.5 | 5.7 |
| 63 | Manchester Township | 43.37K | 0.3 | 6.4 |
| 64 | Palisades Park | 20.88K | 0.8 | 5.1 |
| 65 | Pompton Lakes | 10.95K | 0.7 | 5.3 |
| 66 | Hawthorne | 18.70K | 0.0 | 7.4 |
| 67 | Marlboro Township | 39.85K | 0.2 | 6.9 |
| 68 | Parsippany-Troy Hills Township | 51.91K | 0.4 | 6.3 |
| 69 | Plainsboro Township | 22.98K | 0.4 | 6.6 |
| 70 | Fair Lawn | 33.06K | 0.2 | 7.1 |
| 71 | Medford Township | 23.39K | 0.8 | 5.7 |
| 72 | Jackson Township | 57.38K | 0.4 | 6.8 |
| 73 | Springfield Township, Union County | 17.66K | 0.2 | 7.6 |
| 74 | Bordentown Township | 12.02K | 0.9 | 5.5 |
| 75 | Lyndhurst Township | 22.74K | 0.6 | 6.6 |
| 76 | Rahway | 30.07K | 1.1 | 5.2 |
| 77 | Waterford Township | 10.66K | 1.1 | 5.1 |
| 78 | Beachwood | 11.28K | 0.4 | 7.0 |
| 79 | Scotch Plains Township | 24.38K | 0.6 | 6.6 |
| 80 | East Windsor Township | 27.34K | 0.6 | 6.7 |
| 81 | Princeton | 31.61K | 0.3 | 7.5 |
| 82 | Point Pleasant | 18.68K | 0.8 | 6.2 |
| 83 | Nutley Township | 28.38K | 1.0 | 5.8 |
| 84 | Montville Township | 21.21K | 0.2 | 8.1 |
| 85 | Cranford Township | 24.25K | 0.2 | 8.3 |
| 86 | Howell Township | 52.24K | 0.6 | 7.2 |
| 87 | Old Bridge Township | 65.66K | 0.6 | 7.3 |
| 88 | Sayreville | 44.58K | 0.8 | 7.0 |
| 89 | Wall Township | 25.65K | 0.9 | 6.9 |
| 90 | East Greenwich Township | 10.66K | 0.0 | 9.7 |
| 91 | Florham Park | 11.52K | 0.1 | 9.6 |
| 92 | Little Falls Township | 14.51K | 1.4 | 6.1 |
| 93 | Little Ferry | 10.79K | 0.8 | 7.7 |
| 94 | Piscataway Township | 56.78K | 0.8 | 7.8 |
| 95 | Bridgewater Township | 44.61K | 0.2 | 9.8 |
| 96 | Florence Township | 12.59K | 1.3 | 6.4 |
| 97 | Roselle Park | 13.63K | 0.1 | 9.9 |
| 98 | Fort Lee | 38.06K | 0.7 | 8.5 |
| 99 | Rockaway Township | 25.76K | 0.5 | 9.0 |
| 100 | North Bergen Township | 61.45K | 1.5 | 6.6 |
| 101 | Aberdeen Township | 18.70K | 0.8 | 8.8 |
| 102 | Ridgefield Park | 12.98K | 0.5 | 9.6 |
| 103 | Ramsey | 14.98K | 0.2 | 10.7 |
| 104 | Lacey Township | 29.25K | 0.9 | 9.1 |
| 105 | Rutherford | 18.42K | 0.7 | 9.8 |
| 106 | Stafford Township | 27.61K | 1.2 | 8.4 |
| 107 | Hanover Township | 14.45K | 0.8 | 9.4 |
| 108 | Franklin Township, Somerset County | 66.17K | 0.9 | 9.4 |
| 109 | Little Egg Harbor Township | 21.51K | 0.8 | 9.6 |
| 110 | West Windsor Township | 28.03K | 0.4 | 11.1 |
| 111 | Berkeley Township | 41.74K | 1.1 | 9.2 |
| 112 | East Hanover Township | 10.99K | 0.3 | 11.5 |
| 113 | Livingston Township | 30.0K | 0.2 | 11.8 |
| 114 | Moorestown Township | 20.31K | 0.9 | 9.8 |
| 115 | Lower Township | 21.33K | 1.9 | 7.0 |
| 116 | South River | 15.95K | 2.2 | 6.4 |
| 117 | East Brunswick Township | 47.86K | 0.6 | 11.1 |
| 118 | Teaneck Township | 40.53K | 1.4 | 9.0 |
| 119 | Franklin Township, Gloucester County | 16.26K | 0.9 | 10.4 |
| 120 | Guttenberg | 11.29K | 2.4 | 6.3 |
| 121 | Bloomfield | 50.31K | 0.6 | 11.3 |
| 122 | Lakewood Township | 105.40K | 1.4 | 9.2 |
| 123 | Evesham Township | 45.0K | 0.6 | 11.3 |
| 124 | Haddonfield | 11.26K | 0.4 | 12.0 |
| 125 | Hammonton | 14.0K | 1.8 | 8.2 |
| 126 | Edgewater | 12.82K | 0.3 | 12.5 |
| 127 | North Arlington | 15.71K | 1.2 | 10.1 |
| 128 | Monroe Township, Gloucester County | 36.88K | 0.7 | 11.5 |
| 129 | Red Bank | 12.02K | 1.1 | 10.5 |
| 130 | Metuchen | 14.42K | 0.8 | 11.4 |
| 131 | Brick Township | 75.59K | 1.1 | 10.6 |
| 132 | West Deptford Township | 20.90K | 0.8 | 11.7 |
| 133 | Somerville | 12.20K | 0.9 | 11.3 |
| 134 | East Rutherford | 9.83K | 0.4 | 12.9 |
| 135 | Delran Township | 16.47K | 0.5 | 12.9 |
| 136 | Hazlet Township | 19.74K | 1.6 | 10.1 |
| 137 | Holmdel Township | 16.65K | 1.0 | 11.7 |
| 138 | Wallington | 11.57K | 0.8 | 12.4 |
| 139 | Morristown | 19.15K | 2.1 | 8.9 |
| 140 | Mantua Township | 14.78K | 0.2 | 14.3 |
| 141 | Voorhees Township | 29.10K | 1.0 | 12.1 |
| 142 | Bellmawr | 11.29K | 1.2 | 11.8 |
| 143 | Carteret | 23.65K | 1.4 | 11.2 |
| 144 | Dover | 17.85K | 2.2 | 8.8 |
| 145 | Galloway Township | 35.81K | 1.7 | 10.2 |
| 146 | Tinton Falls | 17.51K | 0.5 | 13.9 |
| 147 | Lodi | 24.49K | 1.4 | 11.1 |
| 148 | Bound Brook | 10.26K | 1.6 | 10.9 |
| 149 | Toms River Township | 93.84K | 0.8 | 13.3 |
| 150 | Burlington Township | 22.52K | 1.4 | 11.6 |
| 151 | Fairview | 14.29K | 1.9 | 10.6 |
| 152 | Edison Township | 100.28K | 0.8 | 13.7 |
| 153 | Saddle Brook Township | 13.90K | 0.1 | 15.8 |
| 154 | Freehold Borough | 11.73K | 1.9 | 11.0 |
| 155 | Woodland Park | 12.66K | 1.1 | 13.2 |
| 156 | Clark Township | 16.02K | 0.9 | 14.0 |
| 157 | Montclair | 38.63K | 1.5 | 12.3 |
| 158 | Hoboken | 53.64K | 1.5 | 12.4 |
| 159 | Gloucester Township | 63.50K | 1.0 | 13.9 |
| 160 | Freehold Township | 34.56K | 1.0 | 14.1 |
| 161 | Bayonne | 65.03K | 2.2 | 10.8 |
| 162 | Elmwood Park | 20.10K | 1.2 | 13.6 |
| 163 | Woodbridge Township | 100.13K | 1.1 | 14.1 |
| 164 | Union Township | 58.74K | 0.7 | 15.5 |
| 165 | Winslow Township | 38.39K | 1.7 | 12.8 |
| 166 | Clifton | 85.02K | 1.1 | 15.0 |
| 167 | Washington Township, Gloucester County | 47.13K | 1.5 | 13.8 |
| 168 | Wayne Township | 53.28K | 0.6 | 16.8 |
| 169 | Mount Laurel Township | 41.11K | 1.4 | 14.5 |
| 170 | Ewing Township | 36.34K | 1.7 | 14.0 |
| 171 | North Brunswick Township | 41.71K | 1.5 | 14.5 |
| 172 | South Orange Village | 16.74K | 0.8 | 16.7 |
| 173 | Englewood | 28.68K | 2.5 | 12.0 |
| 174 | Highland Park | 13.79K | 1.0 | 16.1 |
| 175 | Lawrence Township, Mercer County | 32.42K | 1.4 | 15.2 |
| 176 | North Plainfield | 21.47K | 2.2 | 13.1 |
| 177 | Egg Harbor Township | 42.48K | 1.2 | 15.8 |
| 178 | Totowa | 10.75K | 1.4 | 15.4 |
| 179 | Weehawken Township | 15.12K | 1.5 | 15.3 |
| 180 | Lumberton Township | 12.16K | 1.8 | 14.3 |
| 181 | Glassboro | 20.08K | 1.5 | 15.1 |
| 182 | West Orange | 47.70K | 1.9 | 14.1 |
| 183 | Maplewood Township | 25.30K | 0.9 | 17.2 |
| 184 | Kearny | 41.31K | 1.3 | 16.0 |
| 185 | West New York | 53.15K | 2.4 | 13.0 |
| 186 | South Plainfield | 24.11K | 1.2 | 16.3 |
| 187 | Hackensack | 44.51K | 2.3 | 13.3 |
| 188 | Belleville | 36.53K | 2.1 | 13.9 |
| 189 | Pennsville Township | 12.35K | 1.5 | 16.0 |
| 190 | Perth Amboy | 51.82K | 2.8 | 13.5 |
| 191 | Pine Hill | 10.42K | 2.9 | 13.7 |
| 192 | Middle Township | 18.23K | 1.9 | 16.6 |
| 193 | Hamilton Township, Mercer County | 87.03K | 1.4 | 18.2 |
| 194 | Willingboro Township | 31.92K | 3.2 | 13.2 |
| 195 | Pleasantville | 20.39K | 3.2 | 13.3 |
| 196 | Millburn Township | 20.09K | 0.3 | 21.6 |
| 197 | Manville | 10.21K | 0.6 | 21.4 |
| 198 | Ocean Township, Monmouth County | 26.64K | 0.6 | 21.8 |
| 199 | Pemberton Township | 26.97K | 2.7 | 16.1 |
| 200 | Union City | 68.46K | 2.8 | 15.8 |
| 201 | Garfield | 31.89K | 1.6 | 19.4 |
| 202 | Roselle | 21.90K | 3.1 | 15.5 |
| 203 | Cinnaminson Township | 16.48K | 1.0 | 21.4 |
| 204 | Keansburg | 9.67K | 2.2 | 18.2 |
| 205 | Harrison | 18.37K | 2.6 | 18.6 |
| 206 | East Orange | 64.20K | 4.3 | 13.9 |
| 207 | Haddon Township | 14.49K | 2.3 | 19.9 |
| 208 | Cherry Hill Township | 70.72K | 0.8 | 24.0 |
| 209 | Plainfield | 50.58K | 3.8 | 15.9 |
| 210 | Maple Shade Township | 18.45K | 2.9 | 18.6 |
| 211 | Phillipsburg | 14.23K | 2.1 | 21.4 |
| 212 | Somers Point | 10.22K | 1.1 | 25.4 |
| 213 | Burlington City | 9.88K | 5.2 | 15.2 |
| 214 | Secaucus | 21.22K | 1.9 | 24.3 |
| 215 | Gloucester City | 11.17K | 1.8 | 25.2 |
| 216 | Eatontown | 12.22K | 2.8 | 22.4 |
| 217 | Long Branch | 30.35K | 3.6 | 20.6 |
| 218 | Ocean City | 10.96K | 0.5 | 29.5 |
| 219 | Collingswood | 13.85K | 1.2 | 28.4 |
| 220 | Passaic | 69.64K | 5.3 | 17.4 |
| 221 | Hillside Township | 22.02K | 2.9 | 24.2 |
| 222 | Pennsauken Township | 35.51K | 3.1 | 23.9 |
| 223 | New Brunswick | 56.0K | 4.7 | 19.8 |
| 224 | Irvington | 54.03K | 5.2 | 18.8 |
| 225 | Jersey City | 266.51K | 5.2 | 19.0 |
| 226 | Newark | 281.42K | 6.2 | 16.4 |
| 227 | Hamilton Township, Atlantic County | 25.67K | 1.9 | 30.0 |
| 228 | Vineland | 59.86K | 3.5 | 28.2 |
| 229 | Orange City | 30.56K | 6.2 | 20.8 |
| 230 | Woodbury | 9.77K | 2.9 | 30.6 |
| 231 | Linden | 42.59K | 3.7 | 28.8 |
| 232 | Paramus | 26.46K | 1.7 | 34.7 |
| 233 | Ventnor City | 9.97K | 1.5 | 36.5 |
| 234 | Neptune Township | 27.55K | 3.4 | 31.6 |
| 235 | Deptford Township | 30.26K | 1.3 | 38.8 |
| 236 | Paterson | 144.87K | 8.4 | 21.6 |
| 237 | Lindenwold | 17.20K | 7.2 | 28.6 |
| 238 | Elizabeth | 128.75K | 7.2 | 30.3 |
| 239 | Trenton | 83.46K | 11.2 | 20.9 |
| 240 | Millville | 27.53K | 4.7 | 40.2 |
| 241 | Bridgeton | 24.33K | 9.2 | 34.9 |
| 242 | Asbury Park | 15.44K | 11.6 | 34.0 |
| 243 | Atlantic City | 37.59K | 8.6 | 46.2 |
| 244 | Camden County Police Department | 73.27K | 15.8 | 28.7 |
Find the safest cities in each state
Click on the state image or dropdown menu below to check out the safest cities for each state.
Related articles on SafeWise
Sources
FBI: Uniform Crime Reporting Program, “2019 Crime in the United States,” Accessed March 15, 2021.
US Census Bureau, "Data Explorer," Accessed November 18, 2020.
Best Places, “Find a Place Search Tool,” Accessed January 6, 2021.
SafeWise, “2021 State of Safety survey,” Accessed March 15, 2021.
Gun Violence Archive, “Past Summary Ledgers,” Accessed January 6, 2021.
Gun Violence Archive, “General Methodology,” Accessed March 15, 2021.
Melody Hicks, Ben Stickle, Joshua Harms, American Journal of Criminal Justice, “Assessing the Fear of Package Theft,” January 04, 2021. Accessed March 15, 2021.
For definitions and more on data sources, see our methodology page.


The post New Jersey’s 50 Safest Cities of 2021 appeared first on SafeWise.
Article source here: New Jersey’s 50 Safest Cities of 2021