New York’s 50 Safest Cities of 2021

The SafeWise Team is pleased to release the seventh annual Safest Cities report.
Here are the 10 Safest Cities in New York for 2021
1. Lewisboro Town
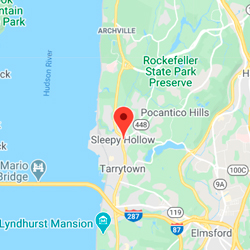
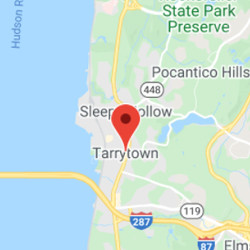
2. Sleepy Hollow Village
3. Kirkland Town
4. Highlands Town
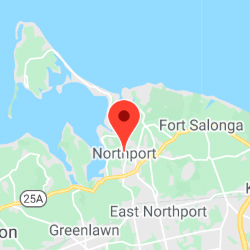
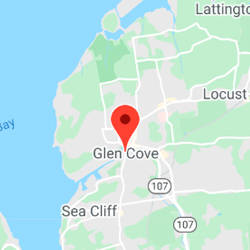
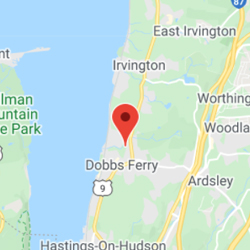
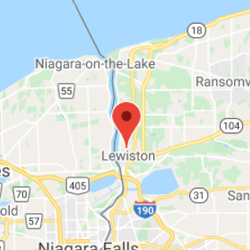
5. Northport Village
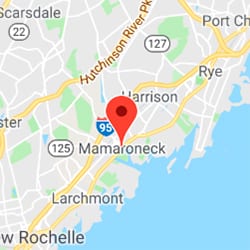
6. Rye
7. Mount Hope Town
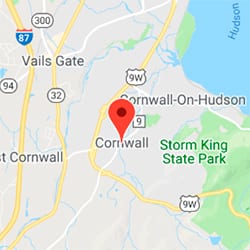
8. Cornwall Town
9. Malverne Village
10. Stillwater Town
See if your city made the full list.
In our 2021 State of Safety survey, 70% of New York residents reported worrying about their safety on a daily basis—this is the highest level of concern in the US, which averages 47%. Survey respondents also noted a big uptick in personal experiences with violent crime, property crime, and gun violence compared to last year.
Still, New York has a lower violent crime rate than the national average and its property crime rate is one of the lowest in the country. The Empire State's 50 safest cities all have crime rates well under the US average.
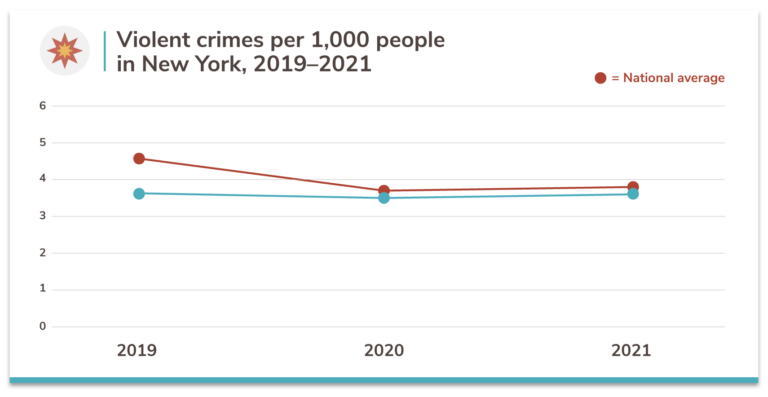
2021 New York crime rates
New York's violent crime rate had a slight increase this year, moving up from 3.5 per 1,000 people to 3.6. In contrast, the state's property crime rate went down from 14.4 per 1,000 people to 13.7.
Within the Mid-Atlantic region, New York had the highest violent crime rate above Pennsylvania (3.1). But it ranked in the middle for its property crime rate—close to New Jersey (13.4).
New York comes in below the national average for violent crimes and property crimes, though its violent crime rate is still close to the US average. Among all 50 states, New York had the twenty-fifth-highest violent crime rate and the sixth-lowest property crime rate.

Level of concern and experience with crime in New York
Compared to last year, more New Yorkers expressed daily concerns for their personal safety, which moved the state to the top spot this year. Residents were also more concerned than any other group of Americans when it came to violent crime, property crime, package theft, gun violence, and police violence.
Survey respondents also reported a greater number of personal experiences with crime and violence in the last 12 months. Violent crime and gun violence accounted for the biggest jump in personal experiences with crime, but encounters with property crime also increased sharply.
We also found that 76% of New Yorkers worry about the coronavirus pandemic on a daily basis. This is much higher than most Americans (62%) and the third-highest in the nation behind Hawaii (80%) and California (77%).

Crime concerns in New York
We asked New York residents which crimes they worry may happen to them. See if New York residents are concerned about the same crime issues as the rest of the country.

View the complete 2021 State of Safety report.
Violent crime in New York: Fear vs. reality
Just two out of five New Yorkers feel safe in their home state—no other state worries more about crime or trusts law enforcement less. This is justifiable when accounting for the state's increased violent crime rate and survey participants' increasing reports of personal experiences with violent crime.
- 40% of New York residents reported feeling safe in their state compared to 55% of Americans.
- 23% of Empire Staters reported having a personal experience with violent crime in the last 12 months—a steep increase from 13% last year.
- Murder is an uncommon violent crime in The Empire State, making up 0.8% of violent crimes (US 1%). There were no murders in the state's 50 safest cities.
- Rape accounts for 9% of violent crimes in New York (US 8%). The 50 safest cities have a higher number of instances at 14%.
- 31% of survey participants report using some form of personal protection like pepper spray—just below the US average (34%).
- 58% of respondents in New York say their personal safety has been affected by the COVID-19 pandemic compared to 44% of Americans—only Florida (61%) and Hawaii (60%) reported higher numbers.
Attitudes about police and gun violence in New York
- Four-fifths (80%) of people in New York said gun violence was a top safety concern—this was the highest in the nation, which averaged 53%.
- About 1 in 5 (18%) survey respondents reported experiencing gun violence in the last 12 months, more than double last year's survey (8%).
- There were 39 mass shootings in New York in 2020—4.3 times higher than 2019, which had 9.
- 72% of New Yorkers worry about police violence daily—this was the highest in the country (US 40%).
- Less than 2 of every 5 residents in New York (38%) reported having confidence in law enforcement. This is the lowest level of confidence in the nation, which averaged 56%.
- There were 64 officer-involved shootings in 2020, down from 65 in 2019.
Property crime in New York: Fear vs. reality
Despite a year-over-year decline in property crimes and one of the lowest property crime rates in the nation, New Yorkers worry more about property crimes than others in the US. Survey respondents' increased reports of personal experiences with property crime and package theft might explain why they worry more than in previous years.
- 1.4 times as many New Yorkers (19%) reported personal experiences with property crime this year as they did last year (14%).
- Burglary accounts for 10% of all property crimes in The Empire State (the 50 safest cities average 11%), which is lower than the national rate of 16%.
- 30% of survey respondents experienced a package theft in the last 12 months—this is 50% higher than the US average of 20% and the highest in the country.
- 57% of residents in New York use some form of property protection—close to the 62% national average.
- The top form of property protection in New York this year was security cameras with 30% of survey respondents using them. This tops the national average of 28%.
- 45% of people in New York say the COVID-19 pandemic has affected the security of their property—this is the highest in the US, which averages 29%.

A closer look at the safest cities in New York
For the purposes of this report, the terms “dangerous” and “safest” refer explicitly to crime rates as calculated from FBI crime data—no other characterization of any community is implied or intended.
- Due to the large number of cities in New York that meet our ranking criteria, we expanded our safest cities list from 20 to 50 this year.
- 2 cities had 0 reported crimes this year, tying them for the top spot—Lewisboro Town, which has held the top spot for 4 consecutive years, and Sleepy Hollow Village.
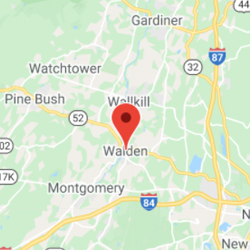
- Walden Village had the biggest jump in ranking from last year. It moved up 36 spots from 77 to 41.
- 88% of the safest cities have populations under 25,000.
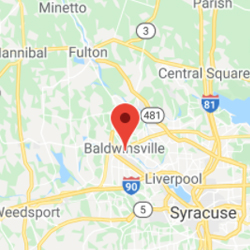
- Last year, 8 of the safest cities reported 0 violent crimes—this year, 13 had 0 violent crimes—Lewisboro Town, Sleepy Hollow Village, Kirkland Town, Highlands Town, Northport Village, Whitestown Town, Briarcliff Manor Village, Tuckahoe Village, Irvington Village, Harrison Town, Bronxville Village, Baldwinsville Village, and Rye Brook Village.
- Lewisboro Town, Kirkland Town, Harrison Town, and Rye Brook Village have had no reports of violent crimes in the last 3 years.
- There were no reported murders among the safest cities. This is exceptional for a state with 50 qualifying cities.
- Each of the top 50 cities reported fewer than 20 violent crimes this year while 96% reported less than 10 violent crimes.
- New York's top 70 safest cities have violent crime rates at or under 1.0 per 1,000 people.
- Lewisboro Town and Sleepy Hollow Village had the lowest property crime rates in the state this year with no reported property crimes whatsoever.
- 94% of the safest cities reported fewer than 100 total property crimes this year while 60% reported less than 50 property crimes.

The 50 Safest Cities in New York

 Population12,582
 Median Income$141,477
 VC Rate 2021, 2020, 20190.0, 0.0, 0.0
![Circle Property]() PC Rate 2021, 2020, 20190.0, 0.0, 0.1
PC Rate 2021, 2020, 20190.0, 0.0, 0.1
-
Population10,080
-
Median Income$65,510
-
VC Rate 2021, 2020, 20190.0, 0.0, N/A
![Circle Property]() PC Rate 2021, 2020, 20190.0, 0.1, N/A
PC Rate 2021, 2020, 20190.0, 0.1, N/A

-
Population8,329
-
Median Income$60,542
-
VC Rate 2021, 2020, 20190.0, 0.0, 0.0
![Circle Property]() PC Rate 2021, 2020, 20190.5, 0.7, 2.4
PC Rate 2021, 2020, 20190.5, 0.7, 2.4

-
Population8,444
-
Median Income$80,038
-
VC Rate 2021, 2020, 20190.0, 0.1, 0.2
![Circle Property]() PC Rate 2021, 2020, 20190.8, 0.5, 1.0
PC Rate 2021, 2020, 20190.8, 0.5, 1.0
-
Population7,288
-
Median Income$115,068
-
VC Rate 2021, 2020, 20190.0, 0.0, 0.5
![Circle Property]() PC Rate 2021, 2020, 20191.0, 3.4, 5.7
PC Rate 2021, 2020, 20191.0, 3.4, 5.7

-
Population15,756
-
Median Income$180,958
-
VC Rate 2021, 2020, 20190.1, 0.4, 0.3
![Circle Property]() PC Rate 2021, 2020, 20191.0, 3.5, 4.6
PC Rate 2021, 2020, 20191.0, 3.5, 4.6

-
Population6,624
-
Median Income$74,435
-
VC Rate 2021, 2020, 20190.2, N/A, 0.0
![Circle Property]() PC Rate 2021, 2020, 20190.9, N/A, 0.7
PC Rate 2021, 2020, 20190.9, N/A, 0.7
-
Population9,502
-
Median Income$85,117
-
VC Rate 2021, 2020, 20190.2, N/A, 0.2
![Circle Property]() PC Rate 2021, 2020, 20190.7, N/A, 2.2
PC Rate 2021, 2020, 20190.7, N/A, 2.2

-
Population8,514
-
Median Income$119,500
-
VC Rate 2021, 2020, 20190.2, 0.2, 0.0
![Circle Property]() PC Rate 2021, 2020, 20191.2, 2.0, 2.6
PC Rate 2021, 2020, 20191.2, 2.0, 2.6

-
Population7,300
-
Median Income$74,086
-
VC Rate 2021, 2020, 20190.1, 0.3, 0.1
![Circle Property]() PC Rate 2021, 2020, 20192.2, 1.6, 4.7
PC Rate 2021, 2020, 20192.2, 1.6, 4.7

-
Population9,096
-
Median Income$55,334
-
VC Rate 2021, 2020, 20190.0, 0.2, 0.1
![Circle Property]() PC Rate 2021, 2020, 20193.1, 3.1, 3.3
PC Rate 2021, 2020, 20193.1, 3.1, 3.3

-
Population10,160
-
Median Income$60,193
-
VC Rate 2021, 2020, 20190.2, 0.0, 0.7
![Circle Property]() PC Rate 2021, 2020, 20192.2, 3.0, 5.4
PC Rate 2021, 2020, 20192.2, 3.0, 5.4

-
Population17,896
-
Median Income$186,493
-
VC Rate 2021, 2020, 20190.1, 0.1, N/A
![Circle Property]() PC Rate 2021, 2020, 20193.0, 2.9, N/A
PC Rate 2021, 2020, 20193.0, 2.9, N/A
-
Population34,251
-
Median Income$105,406
-
VC Rate 2021, 2020, 20190.2, 0.5, 0.3
![Circle Property]() PC Rate 2021, 2020, 20192.2, 3.8, 3.7
PC Rate 2021, 2020, 20192.2, 3.8, 3.7
-
Population17,791
-
Median Income$119,069
-
VC Rate 2021, 2020, 20190.1, 0.2, 0.3
![Circle Property]() PC Rate 2021, 2020, 20193.2, 2.3, 2.1
PC Rate 2021, 2020, 20193.2, 2.3, 2.1
-
Population8,267
-
Median Income$163,795
-
VC Rate 2021, 2020, 20190.0, 0.0, 0.2
![Circle Property]() PC Rate 2021, 2020, 20193.6, 2.0, 2.5
PC Rate 2021, 2020, 20193.6, 2.0, 2.5
-
Population13,853
-
Median Income$86,531
-
VC Rate 2021, 2020, 20190.1, N/A, 0.1
![Circle Property]() PC Rate 2021, 2020, 20193.0, N/A, 5.6
PC Rate 2021, 2020, 20193.0, N/A, 5.6

-
Population13,235
-
Median Income$87,808
-
VC Rate 2021, 2020, 20190.4, 0.1, 0.1
![Circle Property]() PC Rate 2021, 2020, 20192.0, 3.8, 4.7
PC Rate 2021, 2020, 20192.0, 3.8, 4.7
-
Population27,228
-
Median Income$78,066
-
VC Rate 2021, 2020, 20190.2, 0.1, 0.3
![Circle Property]() PC Rate 2021, 2020, 20193.1, 4.0, 5.5
PC Rate 2021, 2020, 20193.1, 4.0, 5.5
-
Population15,927
-
Median Income$114,674
-
VC Rate 2021, 2020, 20190.5, 0.5, 0.6
![Circle Property]() PC Rate 2021, 2020, 20191.6, 2.9, 2.6
PC Rate 2021, 2020, 20191.6, 2.9, 2.6
-
Population20,073
-
Median Income$104,891
-
VC Rate 2021, 2020, 20190.1, 0.2, 0.2
![Circle Property]() PC Rate 2021, 2020, 20193.3, 4.4, 8.5
PC Rate 2021, 2020, 20193.3, 4.4, 8.5

-
Population8,798
-
Median Income$85,061
-
VC Rate 2021, 2020, 20190.2, 0.2, 0.5
![Circle Property]() PC Rate 2021, 2020, 20193.1, 4.8, 10.3
PC Rate 2021, 2020, 20193.1, 4.8, 10.3
-
Population6,584
-
Median Income$78,278
-
VC Rate 2021, 2020, 20190.0, 0.4, 0.2
![Circle Property]() PC Rate 2021, 2020, 20194.3, 2.2, 5.1
PC Rate 2021, 2020, 20194.3, 2.2, 5.1

-
Population8,574
-
Median Income$60,066
-
VC Rate 2021, 2020, 20190.2, N/A, 0.6
![Circle Property]() PC Rate 2021, 2020, 20193.1, N/A, 4.8
PC Rate 2021, 2020, 20193.1, N/A, 4.8

-
Population33,552
-
Median Income$93,722
-
VC Rate 2021, 2020, 20190.6, 0.9, 0.6
![Circle Property]() PC Rate 2021, 2020, 20192.0, 2.4, 5.9
PC Rate 2021, 2020, 20192.0, 2.4, 5.9
-
Population20,808
-
Median Income$75,291
-
VC Rate 2021, 2020, 20190.2, 0.4, 0.5
![Circle Property]() PC Rate 2021, 2020, 20194.0, 4.3, 5.1
PC Rate 2021, 2020, 20194.0, 4.3, 5.1
-
Population6,407
-
Median Income$55,987
-
VC Rate 2021, 2020, 20190.5, 0.5, 0.2
![Circle Property]() PC Rate 2021, 2020, 20192.8, 4.5, 3.2
PC Rate 2021, 2020, 20192.8, 4.5, 3.2

-
Population6,506
-
Median Income$130,919
-
VC Rate 2021, 2020, 20190.0, 0.3, 0.5
![Circle Property]() PC Rate 2021, 2020, 20195.1, 2.6, 2.4
PC Rate 2021, 2020, 20195.1, 2.6, 2.4

-
Population27,946
-
Median Income$111,122
-
VC Rate 2021, 2020, 20190.0, 0.0, 0.0
![Circle Property]() PC Rate 2021, 2020, 20195.3, 3.5, 4.1
PC Rate 2021, 2020, 20195.3, 3.5, 4.1

-
Population6,459
-
Median Income$187,188
-
VC Rate 2021, 2020, 20190.0, N/A, 0.0
![Circle Property]() PC Rate 2021, 2020, 20195.3, N/A, 4.5
PC Rate 2021, 2020, 20195.3, N/A, 4.5

-
Population6,413
-
Median Income$48,229
-
VC Rate 2021, 2020, 20190.2, 0.5, 0.6
![Circle Property]() PC Rate 2021, 2020, 20194.7, 5.6, 5.5
PC Rate 2021, 2020, 20194.7, 5.6, 5.5
-
Population13,785
-
Median Income$65,045
-
VC Rate 2021, 2020, 20190.1, 0.1, 0.2
![Circle Property]() PC Rate 2021, 2020, 20194.9, 5.7, 6.6
PC Rate 2021, 2020, 20194.9, 5.7, 6.6
-
PopulationChester Town
-
Median Income$46,300
-
VC Rate 2021, 2020, 20191.0, 0.4, 0.9
![Circle Property]() PC Rate 2021, 2020, 20190.9, 2.2, 0.9
PC Rate 2021, 2020, 20190.9, 2.2, 0.9
-
Population10,990
-
Median Income$138,477
-
VC Rate 2021, 2020, 20190.4, 0.3, 0.4
![Circle Property]() PC Rate 2021, 2020, 20194.0, 8.3, 8.0
PC Rate 2021, 2020, 20194.0, 8.3, 8.0
-
Population7,931
-
Median Income$58,000
-
VC Rate 2021, 2020, 20190.0, 0.3, 0.8
![Circle Property]() PC Rate 2021, 2020, 20195.8, 6.4, 8.8
PC Rate 2021, 2020, 20195.8, 6.4, 8.8

-
Population7,621
-
Median Income$60,179
-
VC Rate 2021, 2020, 20190.3, 0.0, 0.7
![Circle Property]() PC Rate 2021, 2020, 20194.7, 4.4, 4.8
PC Rate 2021, 2020, 20194.7, 4.4, 4.8
-
Population19,396
-
Median Income$127,813
-
VC Rate 2021, 2020, 20190.3, 0.3, 0.3
![Circle Property]() PC Rate 2021, 2020, 20194.7, 9.6, 5.1
PC Rate 2021, 2020, 20194.7, 9.6, 5.1
-
Population8,131
-
Median Income$127,716
-
VC Rate 2021, 2020, 20190.4, N/A, 0.5
![Circle Property]() PC Rate 2021, 2020, 20194.4, N/A, 4.6
PC Rate 2021, 2020, 20194.4, N/A, 4.6

-
Population15,413
-
Median Income$97,522
-
VC Rate 2021, 2020, 20190.6, 0.3, 0.6
![Circle Property]() PC Rate 2021, 2020, 20193.3, 3.3, 4.9
PC Rate 2021, 2020, 20193.3, 3.3, 4.9
-
Population15,763
-
Median Income$64,475
-
VC Rate 2021, 2020, 20190.3, 0.8, N/A
![Circle Property]() PC Rate 2021, 2020, 20195.5, 9.7, N/A
PC Rate 2021, 2020, 20195.5, 9.7, N/A
-
Population6,670
-
Median Income$72,398
-
VC Rate 2021, 2020, 20190.3, 1.2, 1.0
![Circle Property]() PC Rate 2021, 2020, 20195.4, 9.1, 12.0
PC Rate 2021, 2020, 20195.4, 9.1, 12.0

-
Population28,732
-
Median Income$67,821
-
VC Rate 2021, 2020, 20190.2, 0.4, 0.4
![Circle Property]() PC Rate 2021, 2020, 20196.1, 7.5, 9.4
PC Rate 2021, 2020, 20196.1, 7.5, 9.4
-
Population8,601
-
Median Income$63,940
-
VC Rate 2021, 2020, 20190.3, 0.6, 0.8
![Circle Property]() PC Rate 2021, 2020, 20195.2, 4.3, 6.0
PC Rate 2021, 2020, 20195.2, 4.3, 6.0
-
Population36,426
-
Median Income$100,837
-
VC Rate 2021, 2020, 20190.2, 0.4, 0.3
![Circle Property]() PC Rate 2021, 2020, 20195.9, 5.0, 5.8
PC Rate 2021, 2020, 20195.9, 5.0, 5.8

-
Population11,816
-
Median Income$87,500
-
VC Rate 2021, 2020, 20190.5, 0.7, 0.9
![Circle Property]() PC Rate 2021, 2020, 20194.6, 6.8, 5.2
PC Rate 2021, 2020, 20194.6, 6.8, 5.2

-
Population9,530
-
Median Income$143,105
-
VC Rate 2021, 2020, 20190.0, 0.0, 0.0
![Circle Property]() PC Rate 2021, 2020, 20197.2, 4.8, 9.6
PC Rate 2021, 2020, 20197.2, 4.8, 9.6
-
Population12,088
-
Median Income$116,969
-
VC Rate 2021, 2020, 20190.2, 0.0, 0.1
![Circle Property]() PC Rate 2021, 2020, 20196.5, 6.1, 4.9
PC Rate 2021, 2020, 20196.5, 6.1, 4.9

-
Population9,171
-
Median Income$82,216
-
VC Rate 2021, 2020, 20190.1, 0.8, 1.0
![Circle Property]() PC Rate 2021, 2020, 20197.0, 9.1, 10.7
PC Rate 2021, 2020, 20197.0, 9.1, 10.7
-
Population11,416
-
Median Income$119,826
-
VC Rate 2021, 2020, 20190.5, 0.6, 0.8
![Circle Property]() PC Rate 2021, 2020, 20195.1, 3.5, 4.2
PC Rate 2021, 2020, 20195.1, 3.5, 4.2
-
Population12,248
-
Median Income$158,031
-
VC Rate 2021, 2020, 20190.3, 0.5, N/A
![Circle Property]() PC Rate 2021, 2020, 20196.1, 4.4, N/A
PC Rate 2021, 2020, 20196.1, 4.4, N/A
How we determined the safest cities
Learn how we identified the safest cities on our methodology page.
How to make a safe home anywhere
Whether your city made our list or not, we encourage everyone to be proactive about home security. Learn more about your home security options—and find out which companies we recommend for every budget and lifestyle in our roundup of the Best Home Security Systems.
Didn't find your city in the top 50?
We calculated crime rates for every city in the state that met our population threshold, based on the state’s median population. See how the remaining cities ranked in the list below.
NOTE: If you don’t see your city on the list, it means that it was below the population threshold or didn’t submit a complete crime report to the FBI in 2019.
|
2021 Rank
|
City
|
Population
|
VC per 1,000
 |
PC per 1,000
|
|---|---|---|---|---|
| 51 | Ramapo Town | 94.63K | 0.7 | 4.6 |
| 52 | Lynbrook Village | 19.49K | 0.7 | 4.9 |
| 53 | Scarsdale Village | 17.95K | 0.3 | 6.5 |
| 54 | Hastings-on-Hudson Village | 7.92K | 0.3 | 7.3 |
| 55 | Potsdam Village | 8.92K | 0.2 | 7.5 |
| 56 | Amityville Village | 9.43K | 0.3 | 7.2 |
| 57 | Hamburg Village | 9.73K | 0.2 | 7.8 |
| 58 | Rockville Centre Village | 24.67K | 0.4 | 7.1 |
| 59 | Pleasantville Village | 7.26K | 0.8 | 5.2 |
| 60 | Pelham Village | 6.91K | 0.6 | 6.5 |
| 61 | Ogden Town | 20.14K | 0.5 | 7.0 |
| 62 | Schodack Town | 11.72K | 0.8 | 6.3 |
| 63 | Ossining Village | 24.99K | 0.8 | 6.3 |
| 64 | Port Chester Village | 29.32K | 0.7 | 6.8 |
| 65 | Fishkill Town | 21.31K | 0.4 | 8.9 |
| 66 | Macedon Town and Village | 8.88K | 0.6 | 8.1 |
| 67 | Orangetown Town | 37.37K | 0.9 | 7.1 |
| 68 | Geneseo Village | 8.16K | 0.4 | 10.2 |
| 69 | Mamaroneck Village | 19.18K | 0.8 | 8.2 |
| 70 | Lloyd Town | 10.46K | 0.7 | 9.5 |
| 71 | Brockport Village | 8.24K | 1.2 | 7.2 |
| 72 | Deerpark Town | 7.71K | 1.4 | 6.4 |
| 73 | Lancaster Town | 37.57K | 0.6 | 10.6 |
| 74 | Southampton Town | 51.09K | 0.9 | 9.3 |
| 75 | Garden City Village | 22.51K | 0.4 | 11.9 |
| 76 | Southold Town | 19.92K | 0.8 | 10.5 |
| 77 | Manlius Town | 24.17K | 0.8 | 10.5 |
| 78 | Greenburgh Town | 45.04K | 1.0 | 9.7 |
| 79 | New Windsor Town | 27.97K | 1.0 | 9.7 |
| 80 | Peekskill | 24.24K | 1.2 | 8.6 |
| 81 | Camillus Town and Village | 24.16K | 0.7 | 11.5 |
| 82 | East Rochester Village | 6.52K | 0.9 | 10.6 |
| 83 | Kenmore Village | 15.03K | 0.7 | 11.6 |
| 84 | Larchmont Village | 6.10K | 0.3 | 13.8 |
| 85 | Saugerties Town | 19.10K | 1.4 | 8.6 |
| 86 | Orchard Park Town | 29.60K | 0.8 | 11.7 |
| 87 | Clarkstown Town | 80.60K | 0.7 | 12.2 |
| 88 | New Rochelle | 78.94K | 1.2 | 9.7 |
| 89 | Hudson Falls Village | 7.02K | 2.0 | 6.4 |
| 90 | Niskayuna Town | 22.41K | 0.5 | 13.7 |
| 91 | Glens Falls | 14.31K | 2.0 | 7.0 |
| 92 | Bethlehem Town | 35.28K | 0.8 | 12.4 |
| 93 | Evans Town | 16.12K | 1.2 | 10.6 |
| 94 | Glenville Town | 21.63K | 0.6 | 14.3 |
| 95 | Depew Village | 15.01K | 1.0 | 12.9 |
| 96 | Monroe Village | 8.59K | 0.8 | 13.8 |
| 97 | Freeport Village | 43.06K | 1.7 | 9.9 |
| 98 | Geddes Town | 10.04K | 0.4 | 16.1 |
| 99 | Beacon | 14.51K | 1.7 | 10.3 |
| 100 | North Tonawanda | 30.23K | 1.5 | 11.6 |
| 101 | Horseheads Village | 6.39K | 0.6 | 15.8 |
| 102 | Cohoes | 16.72K | 2.2 | 9.2 |
| 103 | Tonawanda Town | 56.72K | 1.5 | 12.8 |
| 104 | Brighton Town | 36.04K | 0.7 | 17.0 |
| 105 | West Seneca Town | 45.40K | 1.5 | 13.2 |
| 106 | Hamburg Town | 46.45K | 0.9 | 16.0 |
| 107 | Solvay Village | 6.23K | 2.1 | 10.4 |
| 108 | North Syracuse Village | 6.64K | 2.1 | 10.5 |
| 109 | Amherst Town | 120.86K | 1.2 | 15.2 |
| 110 | Coeymans Town | 7.30K | 2.3 | 9.7 |
| 111 | Plattsburgh City | 19.37K | 1.9 | 12.5 |
| 112 | Riverhead Town | 33.54K | 1.0 | 16.9 |
| 113 | Oneonta City | 13.92K | 2.4 | 10.4 |
| 114 | Ulster Town | 12.63K | 1.3 | 16.5 |
| 115 | Amsterdam | 17.77K | 2.3 | 12.4 |
| 116 | Scotia Village | 7.64K | 2.0 | 14.5 |
| 117 | Johnstown | 8.20K | 1.6 | 16.8 |
| 118 | Rome | 32.02K | 1.7 | 16.4 |
| 119 | Tonawanda | 14.75K | 2.6 | 12.7 |
| 120 | Wallkill Town | 29.24K | 1.3 | 19.1 |
| 121 | Geneva | 12.71K | 1.6 | 18.4 |
| 122 | Middletown | 27.80K | 3.1 | 11.1 |
| 123 | Yonkers | 200.08K | 3.5 | 9.1 |
| 124 | Dunkirk | 11.71K | 1.8 | 17.9 |
| 125 | Saratoga Springs | 28.19K | 2.3 | 15.9 |
| 126 | Colonie Town | 79.51K | 0.8 | 23.5 |
| 127 | East Greenbush Town | 16.32K | 0.6 | 24.5 |
| 128 | Greece Town | 95.78K | 1.7 | 19.3 |
| 129 | Guilderland Town | 34.13K | 0.7 | 24.6 |
| 130 | Seneca Falls Town | 8.63K | 1.0 | 23.7 |
| 131 | Niagara Town | 7.96K | 0.5 | 26.6 |
| 132 | Massena Village | 10.18K | 1.1 | 24.2 |
| 133 | Spring Valley Village | 32.37K | 3.6 | 13.1 |
| 134 | Rotterdam Town | 29.86K | 1.1 | 25.3 |
| 135 | DeWitt Town | 25.0K | 1.4 | 24.3 |
| 136 | Cortland | 18.66K | 2.9 | 17.4 |
| 137 | Newburgh Town | 31.13K | 0.7 | 29.3 |
| 138 | Ithaca | 31.12K | 1.3 | 27.0 |
| 139 | Poughkeepsie Town | 38.89K | 1.8 | 25.5 |
| 140 | New Hartford Town and Village | 20.29K | 0.8 | 30.4 |
| 141 | Kingston | 22.84K | 3.0 | 21.8 |
| 142 | Hempstead Village | 55.40K | 5.4 | 10.5 |
| 143 | Monticello Village | 6.39K | 3.9 | 17.7 |
| 144 | Gates Town | 28.37K | 1.9 | 27.4 |
| 145 | Port Jervis | 8.52K | 4.3 | 16.1 |
| 146 | Canandaigua | 10.22K | 4.4 | 17.4 |
| 147 | Olean | 13.50K | 3.3 | 23.0 |
| 148 | Mount Vernon | 67.62K | 5.6 | 12.5 |
| 149 | Cheektowaga Town | 76.82K | 2.4 | 28.0 |
| 150 | Watervliet | 9.95K | 4.4 | 19.9 |
| 151 | Newark Village | 8.80K | 3.2 | 25.9 |
| 152 | New York | 8379.04K | 5.7 | 14.6 |
| 153 | Woodbury Town | 11.01K | 0.3 | 41.8 |
| 154 | Lackawanna | 17.72K | 4.6 | 21.3 |
| 155 | Ogdensburg | 10.48K | 3.4 | 28.2 |
| 156 | Ilion Village | 7.69K | 4.9 | 21.2 |
| 157 | Elmira | 26.96K | 3.1 | 30.8 |
| 158 | Oswego City | 17.24K | 3.0 | 33.8 |
| 159 | Norwich | 6.58K | 4.3 | 28.3 |
| 160 | Gloversville | 14.74K | 4.5 | 27.2 |
| 161 | Lakewood-Busti | 7.19K | 0.7 | 46.2 |
| 162 | Oneida | 10.86K | 3.8 | 34.2 |
| 163 | Poughkeepsie | 30.42K | 7.7 | 16.9 |
| 164 | Herkimer Village | 7.29K | 5.6 | 27.6 |
| 165 | Troy | 49.29K | 6.0 | 27.7 |
| 166 | Jamestown | 29.10K | 6.8 | 29.7 |
| 167 | Utica | 59.84K | 6.2 | 33.2 |
| 168 | Watertown | 25.10K | 6.1 | 35.3 |
| 169 | Schenectady | 65.50K | 8.1 | 27.0 |
| 170 | Albany | 97.22K | 7.6 | 30.0 |
| 171 | Syracuse | 142.44K | 7.9 | 31.3 |
| 172 | Rochester | 205.77K | 7.5 | 34.7 |
| 173 | Johnson City Village | 14.20K | 4.3 | 53.9 |
| 174 | Newburgh | 28.07K | 11.3 | 22.8 |
| 175 | Buffalo | 255.69K | 9.9 | 32.5 |
| 176 | Binghamton | 44.48K | 8.0 | 42.9 |
| 177 | Niagara Falls | 47.90K | 9.0 | 38.6 |
Find the safest cities in each state
Click on the state image or dropdown menu below to check out the safest cities for each state.
Related articles on SafeWise
Sources
FBI: Uniform Crime Reporting Program, “2019 Crime in the United States,” Accessed March 15, 2021.
US Census Bureau, "Data Explorer," Accessed November 18, 2020.
Best Places, “Find a Place Search Tool,” Accessed January 6, 2021.
SafeWise, “2021 State of Safety survey,” Accessed March 15, 2021.
Gun Violence Archive, “Past Summary Ledgers,” Accessed January 6, 2021.
Gun Violence Archive, “General Methodology,” Accessed March 15, 2021.
Melody Hicks, Ben Stickle, Joshua Harms, American Journal of Criminal Justice, “Assessing the Fear of Package Theft,” January 04, 2021. Accessed March 15, 2021.
For definitions and more on data sources, see our methodology page.


The post New York’s 50 Safest Cities of 2021 appeared first on SafeWise.
Article source here: New York’s 50 Safest Cities of 2021