Oklahoma’s 20 Safest Cities of 2021

The SafeWise Team is pleased to release the seventh annual Safest Cities report.

Here are the 10 safest cities in Oklahoma for 2021
1. Elgin
2. Lone Grove
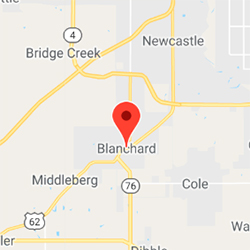
3. Blanchard
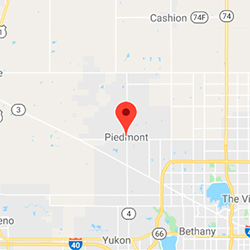
4. Piedmont
5. Antlers
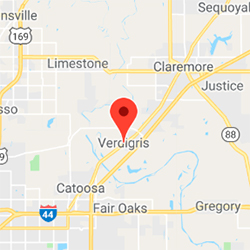
6. Verdigris
7. Hinton
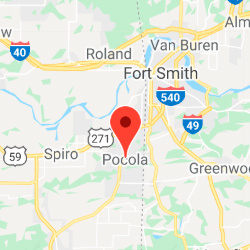
8. Pocola
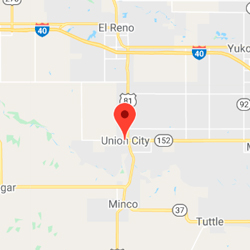
9. Union City
10. Alva
See if your city made the full list.
In our 2021 State of Safety survey, 43% of people in Oklahoma expressed a daily level of high concern for their personal safety—lower than the national average of 47%. Survey respondents also reported fewer personal experiences with crime and violence compared to last year and came in below the US average for each category.
There's a disconnect between the self-reported survey results and Oklahoma's crime rates (sourced from FBI), which are higher than the national average despite decreasing in the last year. Still, crime rates in all 20 of Oklahoma's safest cities came in below state and national averages.
2021 Oklahoma crime rates
Oklahoma's violent crime rate is on the decline this year, dropping from 4.7 incidents per 1,000 people to 4.3. The Sooner State's property crime rate is also going down, but movement from 28.8 per 1,000 to 28.5 is less than most states.
Within the West South Central region, Oklahoma has the second-lowest violent crime and property crime rates. It trails Texas in both violent crime (4.2) and property crime (23.9).
Oklahoma's crime rates are generally higher than those of most states as well as the national average. Among all 50 states, Oklahoma has the fourteenth-highest violent crime rate and the sixth-highest property crime rate.

Level of concern and experience with crime in Oklahoma
Compared to last year, Oklahomans were only slightly more worried about their personal safety on a daily basis. Still, survey respondents reported significantly fewer personal experiences with violent crime (60% lower) and property crime (down 42%) in the last 12 months. Encounters with gun violence were also lower, but the 33% decrease wasn't as pronounced.

Crime concerns in Oklahoma
Compared to last year, Oklahomans were only slightly more worried about their personal safety on a daily basis. Still, survey respondents reported significantly fewer personal experiences with violent crime (60% lower) and property crime (down 42%) in the last 12 months. Encounters with gun violence were also lower, but the 33% decrease wasn't as pronounced.

View the complete 2021 State of Safety report.
Violent crime in Oklahoma: Fear vs. reality
More than half of Oklahoma residents feel safe in their home state, but not nearly as much as the average American. Still, the state had fewer violent crimes compared to last year and respondents reported fewer experiences with violent crime and gun violence. Oklahomans were less likely than any other group of Americans to say the COVID-19 pandemic has impacted their personal safety.
- 52% of people in Oklahoma reported feeling safe in their state compared to 55% of Americans.
- 4% of Oklahoma residents reported having a personal experience with violent crime in the past 12 months—2.5 times fewer than last year (10%).
- Murder is the least common violent crime in The Sooner State, making up 2% of violent crimes (US 1%)—the state's 20 safest cities averaged 3%.
- Rape accounts for 13% of violent crimes in Oklahoma (US 8%). The 20 safest cities have a higher number of instances at 14%.
- 24% of survey participants report using some form of personal protection like pepper spray—far below the US average (34%).
- 25% of Oklahomans say their personal safety has been affected by the COVID-19 pandemic compared to 44% of Americans—no other state reported lower numbers.

Attitudes about police and gun violence in Oklahoma
- 42% of Oklahoma residents named gun violence as a top safety concern—well below the US average of 53%.
- 4% of survey participants reported experiencing gun violence in the last 12 months, down from 6% last year.
- There were 4 mass shootings in Oklahoma in 2019 and 2 in 2020.
- 27% of Oklahomans worry about police violence daily—below the US average of 40%.
- 60% of people in Oklahoma reported having confidence in law enforcement—slightly higher than the US average of 56%.
- There were 49 officer-involved shootings in 2020, a 22% decrease from 63 in 2019.
Property crime in Oklahoma: Fear vs. reality
While people in Oklahoma had fewer experiences with property crime year over year, the property crime rate only made a minimal improvement. Burglaries seem to be more prevalent in Oklahoma than in most other states, but residents rely more on dogs and firearms to protect their property than the average American.
- 15% of Oklahomans reported personal experiences with property crime this year. This is nearly half as many as last year (26%).
- Burglary accounts for 24% of all property crimes in The Sooner State (the 20 safest cities average 21%), which is 1.5 times higher than the national rate of 16%.
- 18% of participants reported experiencing package theft, putting Oklahoma just below the US average of 20%.
- 58% of Oklahoma residents use some form of property protection, just below the 62% national average.
- The top forms of property protection in Oklahoma this year were dogs and firearms with 29% of survey respondents using one or the other. This is higher than the national average of 26% for each type.
- 20% of respondents say the COVID-19 pandemic has impacted the security of their property—this is lower than the US average of 29%.

A closer look at the safest cities in Oklahoma
For the purposes of this report, the terms “dangerous” and “safest” refer explicitly to crime rates as calculated from FBI crime data—no other characterization of any community is implied or intended.
- Elgin is Oklahoma's safest city for the third consecutive year.
- 80% of the safest cities increased in rank year over year with Walters making the biggest jump since last year—it moved up 41 spots from 55 to 14.
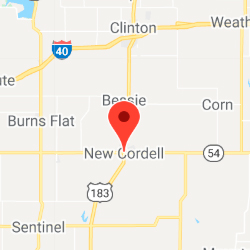
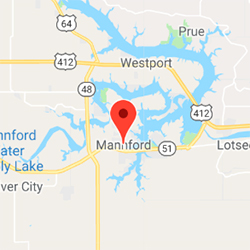
- Mannford and Calera also made big jumps compared to last year—each moved up 27 spots, landing at 12 and 19 respectively.
- 95% of the safest cities have populations under 10,000—only Jenks (population 24,264) was larger.
- 3 cities reported 0 violent crimes in the last year—Elgin, Lone Grove, and Antlers.
- All of the safest cities reported fewer than 30 total violent crimes with 90% reporting fewer than 10.
- Elgin reported just 7 property crimes this year, achieving the lowest property crime rate in the state (2.1).
- 95% of the safest cities reported less than 100 total property crimes this year while 5 reported fewer than 25.

The 20 safest cities in Oklahoma
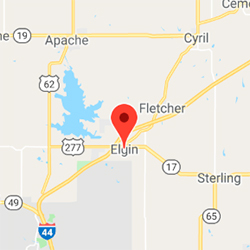
 Population3,294
 Median Income$70,671
 VC Rate 2021, 2020, 20190.0, 0.0, 0.3
![Circle Property]() PC Rate 2021, 2020, 20192.1, 0.3, 2.8
PC Rate 2021, 2020, 20192.1, 0.3, 2.8

-
Population5,111
-
Median Income$48,125
-
VC Rate 2021, 2020, 20190.0, 0.4, 2.1
![Circle Property]() PC Rate 2021, 2020, 20192.5, 6.1, 11.0
PC Rate 2021, 2020, 20192.5, 6.1, 11.0
-
Population9,028
-
Median Income$72,576
-
VC Rate 2021, 2020, 20190.1, 0.6, 0.8
![Circle Property]() PC Rate 2021, 2020, 20198.9, 13.5, 13.1
PC Rate 2021, 2020, 20198.9, 13.5, 13.1
-
Population8,553
-
Median Income$97,733
-
VC Rate 2021, 2020, 20190.9, 0.6, 0.6
![Circle Property]() PC Rate 2021, 2020, 20194.8, 2.4, 4.1
PC Rate 2021, 2020, 20194.8, 2.4, 4.1

-
Population2,296
-
Median Income$25,433
-
VC Rate 2021, 2020, 20190.0, 1.7, 1.3
![Circle Property]() PC Rate 2021, 2020, 201911.3, 4.3, 16.5
PC Rate 2021, 2020, 201911.3, 4.3, 16.5
-
Population4,603
-
Median Income$61,250
-
VC Rate 2021, 2020, 20190.9, 0.2, 0.7
![Circle Property]() PC Rate 2021, 2020, 20196.7, 10.9, 13.1
PC Rate 2021, 2020, 20196.7, 10.9, 13.1

-
Population3,228
-
Median Income$58,947
-
VC Rate 2021, 2020, 20190.6, 0.9, 0.6
![Circle Property]() PC Rate 2021, 2020, 20198.7, 11.1, 9.5
PC Rate 2021, 2020, 20198.7, 11.1, 9.5
-
Population4,124
-
Median Income$42,035
-
VC Rate 2021, 2020, 20191.0, 1.7, 2.5
![Circle Property]() PC Rate 2021, 2020, 20196.8, 2.9, 7.4
PC Rate 2021, 2020, 20196.8, 2.9, 7.4
-
Population2,193
-
Median Income$71,389
-
VC Rate 2021, 2020, 20191.4, 0.5, 1.0
![Circle Property]() PC Rate 2021, 2020, 20195.5, 13.6, 10.2
PC Rate 2021, 2020, 20195.5, 13.6, 10.2

-
Population5,022
-
Median Income$50,349
-
VC Rate 2021, 2020, 20191.2, 1.2, 1.2
![Circle Property]() PC Rate 2021, 2020, 20197.2, 11.2, 13.4
PC Rate 2021, 2020, 20197.2, 11.2, 13.4
-
Population2,753
-
Median Income$43,047
-
VC Rate 2021, 2020, 20190.4, 0.4, 2.1
![Circle Property]() PC Rate 2021, 2020, 201912.7, 14.9, 13.3
PC Rate 2021, 2020, 201912.7, 14.9, 13.3
-
Population3,210
-
Median Income$51,304
-
VC Rate 2021, 2020, 20191.6, 3.4, 1.3
![Circle Property]() PC Rate 2021, 2020, 20198.1, 7.8, 9.5
PC Rate 2021, 2020, 20198.1, 7.8, 9.5

-
Population2,837
-
Median Income$53,558
-
VC Rate 2021, 2020, 20191.1, 1.8, 2.0
![Circle Property]() PC Rate 2021, 2020, 201911.3, 12.3, 14.0
PC Rate 2021, 2020, 201911.3, 12.3, 14.0

-
Population2,379
-
Median Income$48,778
-
VC Rate 2021, 2020, 20190.4, 1.7, 1.6
![Circle Property]() PC Rate 2021, 2020, 201916.0, 21.3, 22.3
PC Rate 2021, 2020, 201916.0, 21.3, 22.3

-
Population3,136
-
Median Income$42,463
-
VC Rate 2021, 2020, 20192.2, 1.3, 1.9
![Circle Property]() PC Rate 2021, 2020, 20195.4, 3.5, 7.1
PC Rate 2021, 2020, 20195.4, 3.5, 7.1
-
Population7,271
-
Median Income$56,795
-
VC Rate 2021, 2020, 20191.5, 1.3, 0.9
![Circle Property]() PC Rate 2021, 2020, 20199.9, 13.7, 16.1
PC Rate 2021, 2020, 20199.9, 13.7, 16.1

-
Population24,264
-
Median Income$93,364
-
VC Rate 2021, 2020, 20191.1, 1.1, 1.9
![Circle Property]() PC Rate 2021, 2020, 201912.3, 13.1, 12.6
PC Rate 2021, 2020, 201912.3, 13.1, 12.6
-
Population4,476
-
Median Income$39,375
-
VC Rate 2021, 2020, 20191.8, 1.6, 1.1
![Circle Property]() PC Rate 2021, 2020, 20198.7, 12.9, 9.7
PC Rate 2021, 2020, 20198.7, 12.9, 9.7

-
Population2,375
-
Median Income$45,903
-
VC Rate 2021, 2020, 20191.7, 2.6, 8.3
![Circle Property]() PC Rate 2021, 2020, 201910.1, 13.7, 9.6
PC Rate 2021, 2020, 201910.1, 13.7, 9.6

-
Population4,746
-
Median Income$58,618
-
VC Rate 2021, 2020, 20191.7, 2.5, 4.3
![Circle Property]() PC Rate 2021, 2020, 201910.3, 12.5, 17.0
PC Rate 2021, 2020, 201910.3, 12.5, 17.0
How we determined the safest cities
Learn how we identified the safest cities on our methodology page.
How to make a safe home anywhere
Whether your city made our list or not, we encourage everyone to be proactive about home security. Learn more about your home security options—and find out which companies we recommend for every budget and lifestyle in our roundup of the Best Home Security Systems.
Didn't find your city in the top 20?
We calculated crime rates for every city in the state that met our population threshold, based on the state’s median population. See how the remaining cities ranked in the list below.
NOTE: If you don’t see your city on the list, it means that it was below the population threshold or didn’t submit a complete crime report to the FBI in 2019.
|
2021 Rank
|
City
|
Population
|
VC per 1,000
 |
PC per 1,000
|
|---|---|---|---|---|
| 21 | Bixby | 28.38K | 1.1 | 14.1 |
| 22 | Choctaw | 12.81K | 1.1 | 14.0 |
| 23 | Mustang | 22.63K | 2.1 | 9.9 |
| 24 | Blackwell | 6.61K | 2.0 | 10.7 |
| 25 | Tuttle | 7.55K | 1.7 | 13.1 |
| 26 | Tishomingo | 3.04K | 2.0 | 12.2 |
| 27 | Spiro | 2.17K | 2.8 | 7.8 |
| 28 | Fort Gibson | 3.97K | 3.0 | 7.0 |
| 29 | Yukon | 28.18K | 1.6 | 15.5 |
| 30 | Nichols Hills | 3.95K | 0.8 | 20.5 |
| 31 | Harrah | 6.60K | 0.8 | 20.6 |
| 32 | Hennessey | 2.24K | 2.2 | 12.0 |
| 33 | Broken Arrow | 110.48K | 1.2 | 17.9 |
| 34 | Dewey | 3.41K | 1.5 | 16.7 |
| 35 | Edmond | 94.70K | 1.5 | 16.9 |
| 36 | Newcastle | 10.65K | 0.8 | 21.8 |
| 37 | Coweta | 10.02K | 2.3 | 13.5 |
| 38 | Perkins | 2.83K | 0.4 | 25.4 |
| 39 | Fairview | 2.60K | 3.1 | 9.6 |
| 40 | Elk City | 11.51K | 1.1 | 21.8 |
| 41 | Healdton | 2.69K | 2.6 | 13.4 |
| 42 | Heavener | 3.29K | 2.7 | 13.1 |
| 43 | Stigler | 2.72K | 1.8 | 18.8 |
| 44 | Vinita | 5.34K | 2.1 | 17.8 |
| 45 | Newkirk | 2.18K | 2.8 | 13.8 |
| 46 | Hobart | 3.40K | 2.4 | 16.5 |
| 47 | Commerce | 2.39K | 3.8 | 8.4 |
| 48 | Drumright | 2.82K | 0.7 | 26.3 |
| 49 | El Reno | 19.83K | 2.1 | 18.9 |
| 50 | Guymon | 11.25K | 3.2 | 12.9 |
| 51 | Tonkawa | 3.01K | 2.3 | 18.6 |
| 52 | Roland | 3.89K | 1.8 | 21.8 |
| 53 | Moore | 63.0K | 1.7 | 22.6 |
| 54 | Guthrie | 11.60K | 1.9 | 21.9 |
| 55 | Lexington | 2.15K | 2.3 | 19.5 |
| 56 | Skiatook | 8.04K | 1.5 | 24.4 |
| 57 | Owasso | 37.65K | 2.1 | 20.8 |
| 58 | Jones | 3.20K | 1.6 | 24.1 |
| 59 | Wagoner | 9.15K | 1.5 | 24.4 |
| 60 | Claremore | 18.79K | 1.2 | 26.3 |
| 61 | Weatherford | 12.19K | 2.1 | 22.2 |
| 62 | Noble | 6.92K | 2.5 | 20.1 |
| 63 | Altus | 18.57K | 2.3 | 21.4 |
| 64 | Pawnee | 2.11K | 2.8 | 18.0 |
| 65 | Perry | 4.91K | 2.4 | 21.2 |
| 66 | Woodward | 12.20K | 2.5 | 20.7 |
| 67 | Marlow | 4.40K | 2.3 | 22.5 |
| 68 | Stroud | 2.71K | 2.9 | 18.8 |
| 69 | Prague | 2.39K | 2.5 | 21.8 |
| 70 | The Village | 9.54K | 2.2 | 23.9 |
| 71 | Sulphur | 5.03K | 2.0 | 25.3 |
| 72 | Mangum | 2.74K | 3.3 | 18.3 |
| 73 | Spencer | 3.99K | 3.0 | 21.1 |
| 74 | Davis | 2.91K | 2.1 | 26.8 |
| 75 | Hominy | 3.38K | 4.1 | 15.1 |
| 76 | Stillwater | 51.01K | 3.1 | 21.3 |
| 77 | Wynnewood | 2.21K | 5.9 | 5.4 |
| 78 | Marietta | 2.77K | 1.8 | 29.6 |
| 79 | Kingfisher | 4.96K | 3.4 | 21.4 |
| 80 | Henryetta | 5.52K | 2.0 | 29.9 |
| 81 | Norman | 125.08K | 2.7 | 26.1 |
| 82 | Nicoma Park | 2.48K | 1.6 | 32.6 |
| 83 | Sapulpa | 20.89K | 2.8 | 26.1 |
| 84 | Bristow | 4.20K | 2.4 | 28.6 |
| 85 | Duncan | 22.30K | 1.7 | 32.9 |
| 86 | Nowata | 3.60K | 3.6 | 22.5 |
| 87 | Chandler | 3.09K | 4.8 | 16.8 |
| 88 | Madill | 4.06K | 2.5 | 31.3 |
| 89 | Seminole | 7.13K | 3.1 | 29.0 |
| 90 | Lindsay | 2.80K | 2.9 | 30.7 |
| 91 | Cushing | 7.64K | 1.3 | 40.5 |
| 92 | Tahlequah | 16.86K | 0.7 | 44.4 |
| 93 | Holdenville | 5.52K | 3.6 | 27.2 |
| 94 | Sallisaw | 8.39K | 3.2 | 29.8 |
| 95 | Midwest City | 57.68K | 2.7 | 33.0 |
| 96 | Bartlesville | 36.50K | 3.0 | 31.4 |
| 97 | Eufaula | 2.91K | 3.4 | 29.9 |
| 98 | Clinton | 9.18K | 5.0 | 20.8 |
| 99 | Cache | 2.81K | 6.4 | 12.8 |
| 100 | Sand Springs | 20.02K | 1.1 | 43.8 |
| 101 | Jay | 2.53K | 4.3 | 25.7 |
| 102 | Grove | 7.13K | 2.4 | 37.5 |
| 103 | Wilburton | 2.56K | 5.5 | 19.9 |
| 104 | Purcell | 6.48K | 3.1 | 34.3 |
| 105 | Glenpool | 14.36K | 5.4 | 20.8 |
| 106 | Tecumseh | 6.67K | 4.0 | 29.1 |
| 107 | Chickasha | 16.40K | 4.3 | 27.5 |
| 108 | Atoka | 3.13K | 2.6 | 39.0 |
| 109 | Enid | 49.60K | 4.1 | 32.8 |
| 110 | Pryor Creek | 9.40K | 6.0 | 22.0 |
| 111 | Bethany | 19.35K | 3.8 | 35.6 |
| 112 | Miami | 13.08K | 5.4 | 28.8 |
| 113 | Poteau | 8.96K | 4.1 | 37.6 |
| 114 | Muldrow | 3.23K | 6.2 | 25.7 |
| 115 | Ada | 17.32K | 4.1 | 38.9 |
| 116 | Durant | 18.48K | 3.6 | 42.3 |
| 117 | Frederick | 3.56K | 6.2 | 28.4 |
| 118 | Wewoka | 3.25K | 5.8 | 31.7 |
| 119 | Checotah | 3.14K | 4.8 | 38.2 |
| 120 | Stilwell | 4.05K | 5.2 | 36.0 |
| 121 | Pawhuska | 3.41K | 5.6 | 34.6 |
| 122 | Hugo | 5.08K | 4.7 | 45.7 |
| 123 | Warr Acres | 10.33K | 6.9 | 33.3 |
| 124 | Ponca City | 23.88K | 6.4 | 39.1 |
| 125 | Shawnee | 31.63K | 4.9 | 48.0 |
| 126 | Anadarko | 6.54K | 7.3 | 34.1 |
| 127 | Okemah | 3.17K | 4.1 | 56.8 |
| 128 | Oklahoma City | 657.89K | 7.2 | 40.9 |
| 129 | Okmulgee | 11.70K | 6.2 | 48.1 |
| 130 | Lawton | 92.26K | 9.3 | 32.2 |
| 131 | Pauls Valley | 6.16K | 4.9 | 57.8 |
| 132 | Ardmore | 24.83K | 8.3 | 42.1 |
| 133 | McAlester | 17.84K | 5.5 | 58.2 |
| 134 | Catoosa | 6.98K | 5.4 | 59.9 |
| 135 | Del City | 21.79K | 8.6 | 43.2 |
| 136 | Muskogee | 37.17K | 10.5 | 35.9 |
| 137 | Idabel | 6.82K | 6.3 | 63.2 |
| 138 | Broken Bow | 4.05K | 9.1 | 55.0 |
| 139 | Tulsa | 401.70K | 9.9 | 53.1 |
Find the safest cities in each state
Click on the state image or dropdown menu below to check out the safest cities for each state.
Related articles on SafeWise
Sources
FBI: Uniform Crime Reporting Program, “2019 Crime in the United States,” Accessed March 15, 2021.
US Census Bureau, "Data Explorer," Accessed November 18, 2020.
Best Places, “Find a Place Search Tool,” Accessed January 6, 2021.
SafeWise, “2021 State of Safety survey,” Accessed March 15, 2021.
Gun Violence Archive, “Past Summary Ledgers,” Accessed January 6, 2021.
Gun Violence Archive, “General Methodology,” Accessed March 15, 2021.
Melody Hicks, Ben Stickle, Joshua Harms, American Journal of Criminal Justice, “Assessing the Fear of Package Theft,” January 04, 2021. Accessed March 15, 2021.
For definitions and more on data sources, see our methodology page.


The post Oklahoma’s 20 Safest Cities of 2021 appeared first on SafeWise.
Article source here: Oklahoma’s 20 Safest Cities of 2021