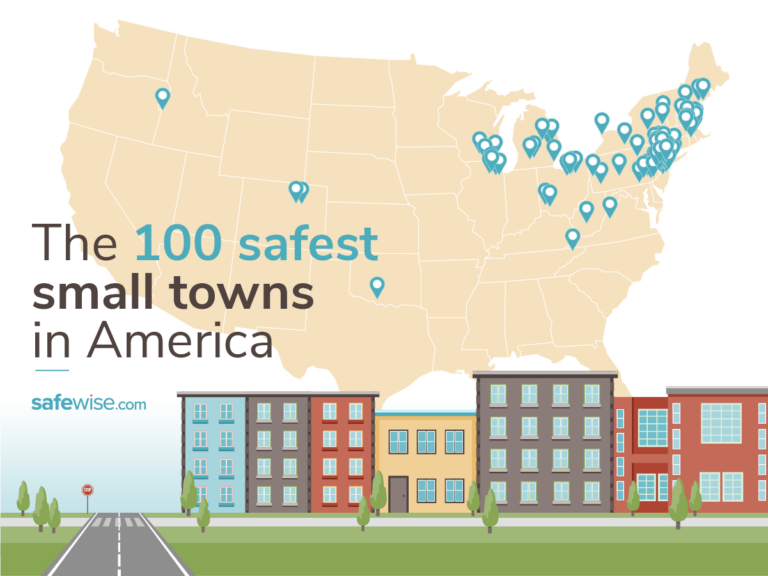
100 Safest Small Towns in America 2021

The draw of idealized Normal Rockwell communities may be growing as headlines continue to highlight big crime in big cities across the country. Lucky for us, America is full of small towns that capture that nostalgic feeling—and nearly non-existent crime rates are the cherry on top.
Here are the 10 safest small towns in America for 2021
Note: There’s a five-way tie for number one.
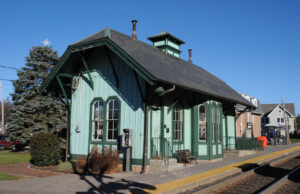
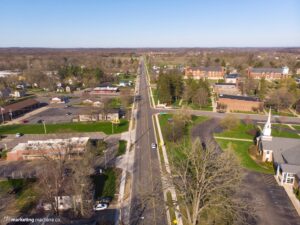
1. Lewisboro Town, New York
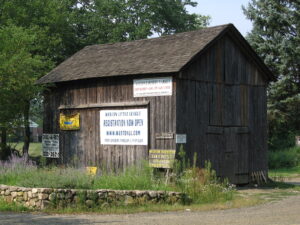
1. Luzerne Township, Pennsylvania
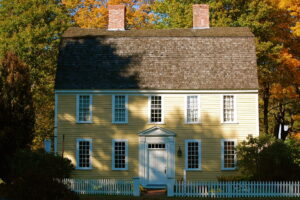
1. Sleepy Hollow Village, New York
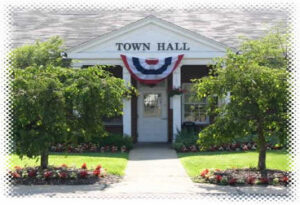
1. Thetford Township, Michigan
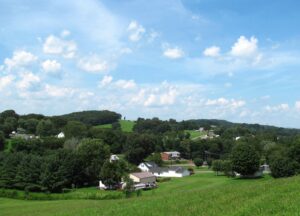
1. Weiser, Idaho
6. Wayland, Massachusetts
7. New Hanover Township, New Jersey
8. Elmira Town, New York
9. Kirkland Town, New York
10. Matawan, New Jersey
See the rest of the safest small towns in America.
Why focus on small towns?
It might surprise you to learn that most Americans live in small towns. According to the 2020 Census, 63% of Americans live in an incorporated place , and 76% of those places are home to fewer than 5,000 people. In fact, only 4% of all cities in the US have 50,000 or more residents.¹
Throughout the novel coronavirus pandemic, there’s been a lot of buzz about people fleeing the big city for simpler life in a small town. Everything from remote work to spiking violent crime rates in larger locales has been credited with the exodus.
But it turns out the trends we’ve seen during the pandemic started before COVID-19 began holding us hostage. For those who are leaving the bustle behind for bucolic reverie, the sense of safety associated with small-town life may play a factor—but small towns have crime too.
As part of our Safest Cities series, we look at crime rates in cities of all different sizes. On top of our overall 100 Safest Cities in America report, we think it helps to hone in on crime trends in cities of similar sizes. So we report on both major metro areas and smaller towns.
Life in small-town America vs. the big city
It’s easy to conjure an image of life in a small town. Dozens of pop culture references (from Gilmore Girls to The Andy Griffith Show) are burned into our brains, but an unending parade of town festivals and folks relying more on the sheriff than locks to keep their home safe don’t necessarily line up with reality.
When it comes to the things that impact everyday life—like financial well-being and educational opportunities—how do the small towns that report the fewest crimes stack up against the country’s major metro areas?
Why do small towns report less crime?
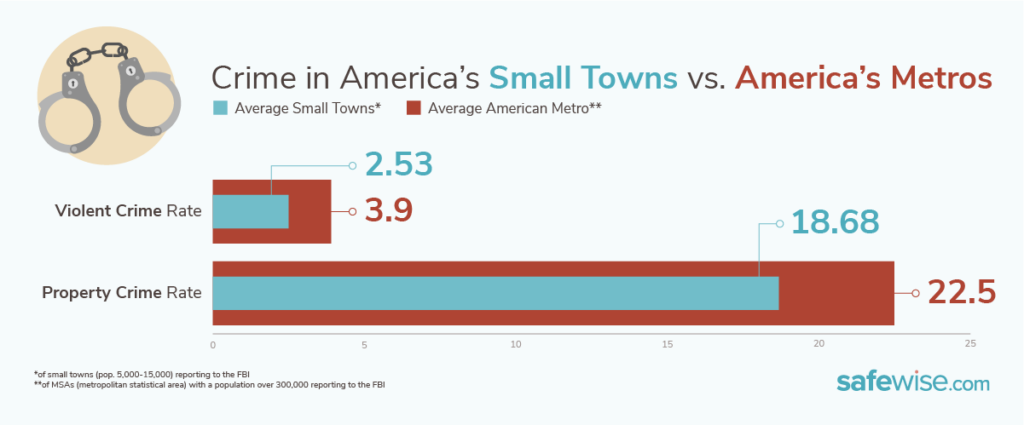
On one hand, you could say that small towns experience less of everything—fewer weddings, fewer funerals, fewer high school reunions—but that’s an oversimplification. The fact is that urban areas consistently see more crime than rural areas—three to four times more according to some analyses.²
But can we put our finger on why? Unfortunately, there’s no easy answer. Socioeconomic factors certainly play a role. And, broadly speaking, crime tends to be more rampant when there’s more opportunity for it to occur. In a larger, urban setting, there are more opportunities and fewer familiar eyes on homes, cars, packages, etc.
Conversely, people are more likely to know one another (or they’ll at least know your mom) in a smaller community. Familiarity makes it harder for crime to slide under the radar like it may in a big city with more anonymity.
Are there similarities in towns that report no crime?
The first five cities on our list reported zero incidents of both violent and property crime. That prompted us to ask, “What makes those five small towns similar?” The answer: almost nothing.
Other than meeting our population threshold, these tiny towns don’t have much in common. Here’s a rundown of what we learned:
- These 5 cities hail from all across the country—Idaho to New York—although the majority are in the Northeast, which traditionally has the highest concentration of towns with little or no crime reported.
- Populations range from 5,300 to over 12,500.
- Median household income ranges from around $36,000 per year to over $158,000.
- The percentage of residents living below the poverty line ranges from 4% to 22%.
- The percentage of residents with a high school diploma ranges from 75% to 91.5%.
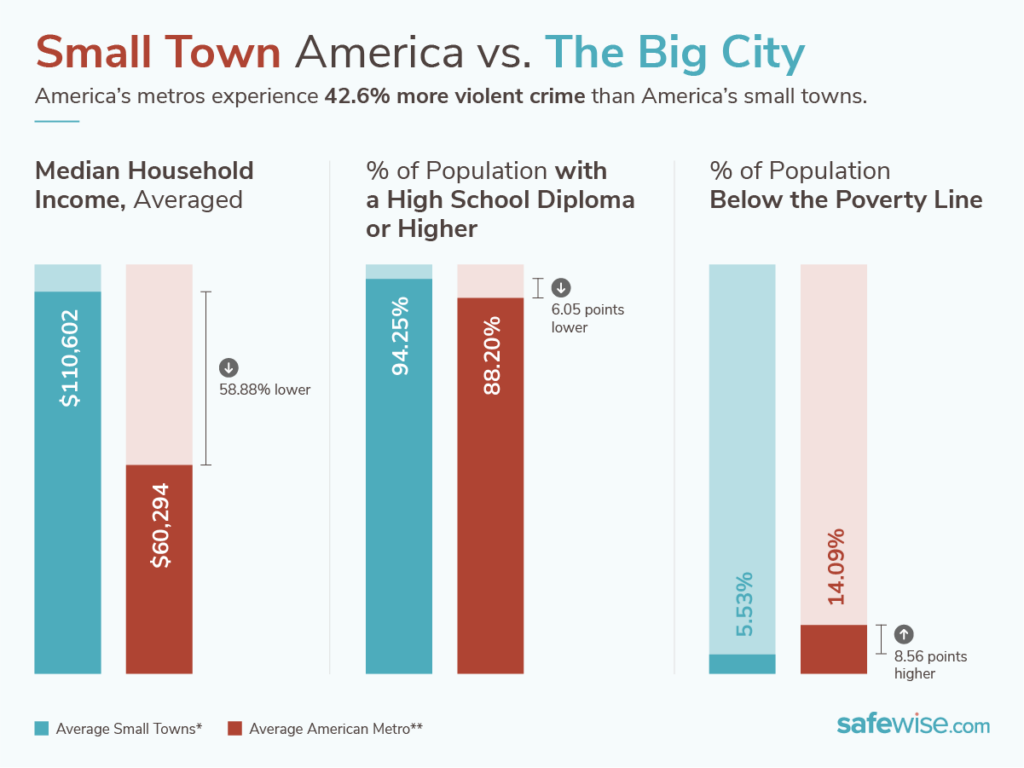
Overwhelmingly, when compared to big cities, the 100 towns that made our list have higher numbers when it comes to median household income and the number of high school graduates. Similarly, these smaller towns report a lower percentage of people living below the poverty line.
Those numbers could lead us to conclude that more resources correlates to lower crime rates. But those few factors, along with numbers of reported crimes, are still just the tip of the iceberg when it comes to analyzing everything that impacts both the safety and overall quality of life in a community, large or small.
And, as we’ve stated before, small towns still see their share of crime. Big cities have nabbed the most headlines for rising murder rates in 2020, but small towns weren’t immune. During the first nine months of 2020, New York City reported a 40% increase in murders year over year. For that same time period, cities with fewer than 10,000 people saw a 30% jump in homicides, which matches the FBI’s final nationwide estimate for 2020.⁵
But it’s not all bad news. Among the 100 cities on our list this year, there were six murders total, down from nine the previous year—that’s a 33% drop.
Which small towns reported the most crime?
During our analysis, we also noted the small towns that reported the most crimes. To put the stellar records of our 100 safest small towns in perspective, here’s a look at the small towns that reported the most violent crimes and the most property crimes. These cities met our criteria to be considered for ranking, but didn’t land in the top 100.
Violent crime

Image source: Wikimedia Commons
Sauk Village, Illinois is the small town that reported the highest number of violent crimes to the FBI in 2019. Here’s what we learned about violent crime in Sauk Village:
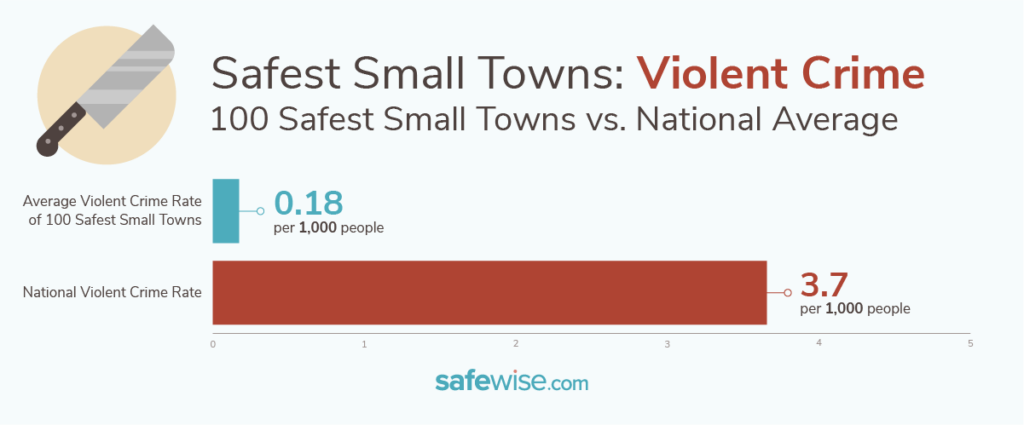
- The town reported 54.9 violent crimes per 1,000 residents (US 3.7).
- Your risk of being a victim of violent crime is 1 in 18.
- The total number of violent crimes reported is more than 3 times the number of violent crimes that took place in the 100 safest small towns combined.
- Aggravated assault was the most common violent crime reported, with 490 incidents.
- Surprisingly, there were over twice as many violent crimes reported compared to the number of property crimes.
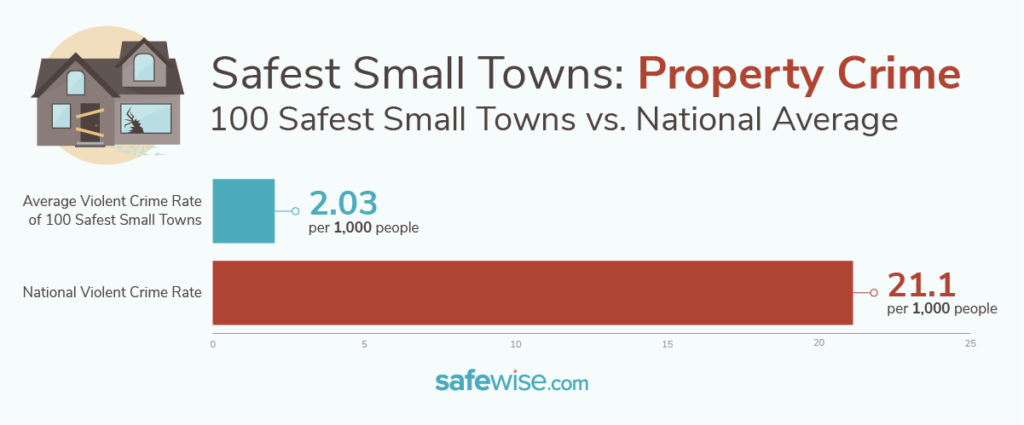
Property crime

Image source: Wikimedia Commons
Emeryville, California reported the highest number of property crime incidents in 2019(TOOLTIP). Here’s what we learned about property crime in Emeryville.
- The town reported 211.9 property crimes per 1,000 incidents (US 21.1).
- Your risk of being a victim of property crime is nearly 1 in 5.
- Your risk of being a victim of motor vehicle theft is 1 in 109.
- Larceny-theft was the most common property crime reported, accounting for 92% of all reported incidents.
A closer look at the safest small towns
Crime in small towns can be surprising. Unlike the safest and most dangerous metros, this year’s safest small towns saw a rise in violent crime year over year. Collectively, we saw a 38% rise in the violent crime rate among our safest small towns this year.
With nearly half of the towns this year making their first appearance on the list, it’s hard to nail down the reason these little burgs saw a rise when both the safest and most dangerous metro cities declined year over year.
The news gets better when we look at property crime. Among the 100 safest small towns, there was a 17% decline in property crimes compared to the cities that made the list last year. This drop mimicked national trends across the board, including among our safest and most dangerous metros.
Interesting findings
- 5 cities tied for first place with zero crimes reported: Lewisboro Town, New York; Luzerne Township, Pennsylvania; Sleepy Hollow Village, New York; Thetford Township, Michigan: and Weiser, Idaho.
- For the second year in a row, the Northeast boasts the most safe small towns. New Jersey leads the pack with 27, followed by New York with 17, Massachusetts with 13, and Pennsylvania with 8.
- 5 states had only 1 city each on the list: Idaho, Connecticut, Oklahoma, Tennessee, and Virginia. But this is an elite ranking—32 states had no cities on the list.
- Norwood Borough, New Jersey saw the biggest drop year over year, falling 70 places, from 29 to 99.
- Old Tappan, New Jersey made the most impressive jump, climbing 64 spots from 90 to 26 this year.
- 49 towns made the list for the first time this year.
- Raisin Township, Michigan reported the highest violent crime rate among the safest small towns, reporting 0.8 incidents per 1,000 people.
- Brookline Town, New Hampshire, reported the highest property crime rate on our list, with 3.8 incidents per 1,000.
America's 100 safest small towns
For the purposes of this report, the terms “safest” and “dangerous” refer explicitly to crime rates as calculated from FBI crime data—no other characterization of any community is implied or intended.
*"T-" indicates a tie.
 Population12,582
 Violent Crime Rate (per 1,000)0.0
![Circle Property]() Property Crime Rate (per 1,000)0.0
Property Crime Rate (per 1,000)0.0 Image Sourcelewisborogov.com

-
Population5,896
-
Violent Crime Rate (per 1,000)0.0
![Circle Property]() Property Crime Rate (per 1,000)0.0
Property Crime Rate (per 1,000)0.0-
Image SourceWikimedia Commons
-
Population10,080
-
Violent Crime Rate (per 1,000)0.0
![Circle Property]() Property Crime Rate (per 1,000)0.0
Property Crime Rate (per 1,000)0.0-
Image Sourcesleepyhollowny.gov

-
Population6,689
-
Violent Crime Rate (per 1,000)0.0
![Circle Property]() Property Crime Rate (per 1,000)0.0
Property Crime Rate (per 1,000)0.0-
Image SourceFacebook | Thetford Township

-
Population5,369
-
Violent Crime Rate (per 1,000)0.0
![Circle Property]() Property Crime Rate (per 1,000)0.0
Property Crime Rate (per 1,000)0.0-
Image Source
-
Population13,891
-
Violent Crime Rate (per 1,000)0.0
![Circle Property]() Property Crime Rate (per 1,000)0.1
Property Crime Rate (per 1,000)0.1-
Image SourceWikimedia Commons
-
Population8,123
-
Violent Crime Rate (per 1,000)0.1
![Circle Property]() Property Crime Rate (per 1,000)0.0
Property Crime Rate (per 1,000)0.0-
Image SourceWikimedia Commons
-
Population5,589
-
Violent Crime Rate (per 1,000)0.0
![Circle Property]() Property Crime Rate (per 1,000)0.4
Property Crime Rate (per 1,000)0.4-
Image SourceWikimedia Commons
-
Population8,329
-
Violent Crime Rate (per 1,000)0.0
![Circle Property]() Property Crime Rate (per 1,000)0.5
Property Crime Rate (per 1,000)0.5-
Image SourceWikimedia Commons
-
Population8,716
-
Violent Crime Rate (per 1,000)0.0
![Circle Property]() Property Crime Rate (per 1,000)0.6
Property Crime Rate (per 1,000)0.6-
Image SourceWikimedia Commons

-
Population8,444
-
Violent Crime Rate (per 1,000)0.0
![Circle Property]() Property Crime Rate (per 1,000)0.8
Property Crime Rate (per 1,000)0.8-
Image SourceWikimedia Commons

-
Population11,202
-
Violent Crime Rate (per 1,000)0.1
![Circle Property]() Property Crime Rate (per 1,000)0.6
Property Crime Rate (per 1,000)0.6-
Image SourceFacebook | Village of Campton Hills

-
Population14,238
-
Violent Crime Rate (per 1,000)0.0
![Circle Property]() Property Crime Rate (per 1,000)1.0
Property Crime Rate (per 1,000)1.0-
Image SourceWikimedia Commons

-
Population7,288
-
Violent Crime Rate (per 1,000)0.0
![Circle Property]() Property Crime Rate (per 1,000)1.0
Property Crime Rate (per 1,000)1.0-
Image SourceWikimedia Commons
-
Population8,761
-
Violent Crime Rate (per 1,000)0.1
![Circle Property]() Property Crime Rate (per 1,000)1.0
Property Crime Rate (per 1,000)1.0-
Image SourceWikimedia Commons

-
Population9,502
-
Violent Crime Rate (per 1,000)0.2
![Circle Property]() Property Crime Rate (per 1,000)0.7
Property Crime Rate (per 1,000)0.7-
Image Sourcecornwallny.com
-
Population10,254
-
Violent Crime Rate (per 1,000)0.0
![Circle Property]() Property Crime Rate (per 1,000)1.5
Property Crime Rate (per 1,000)1.5-
Image Source

-
Population5,295
-
Violent Crime Rate (per 1,000)0.0
![Circle Property]() Property Crime Rate (per 1,000)1.5
Property Crime Rate (per 1,000)1.5-
Image SourceWikimedia Commons
-
Population10,322
-
Violent Crime Rate (per 1,000)0.0
![Circle Property]() Property Crime Rate (per 1,000)1.5
Property Crime Rate (per 1,000)1.5-
Image Sourcechestertwp.com
-
Population6,671
-
Violent Crime Rate (per 1,000)0.0
![Circle Property]() Property Crime Rate (per 1,000)1.5
Property Crime Rate (per 1,000)1.5-
Image SourceWikimedia Commons
-
Population8,009
-
Violent Crime Rate (per 1,000)0.1
![Circle Property]() Property Crime Rate (per 1,000)1.2
Property Crime Rate (per 1,000)1.2-
Image SourceFacebook | Spring Arbor Township
-
Population8,352
-
Violent Crime Rate (per 1,000)0.0
![Circle Property]() Property Crime Rate (per 1,000)1.6
Property Crime Rate (per 1,000)1.6-
Image SourceWikimedia Commons

-
Population6,624
-
Violent Crime Rate (per 1,000)0.2
![Circle Property]() Property Crime Rate (per 1,000)0.9
Property Crime Rate (per 1,000)0.9-
Image SourceFacebook | Town of Mount Hope

-
Population5,032
-
Violent Crime Rate (per 1,000)0.2
![Circle Property]() Property Crime Rate (per 1,000)1.2
Property Crime Rate (per 1,000)1.2-
Image Sourcelapeertwp.org
-
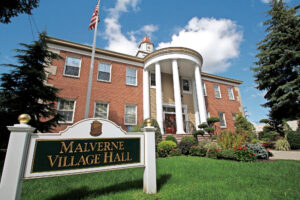
Population8,514
-
Violent Crime Rate (per 1,000)0.2
![Circle Property]() Property Crime Rate (per 1,000)1.2
Property Crime Rate (per 1,000)1.2-
Image Sourcemalvernevillage.org
The rest of the top 100 safest small towns
We calculated crime rates for every small town in the country that met our criteria. Out of 2,111 cities, these are the ones that round out the top 100.
|
2021 Rank
|
City
|
State
|
2020 Rank
|
Population
|
VC per 1,000
 |
PC per 1,000
|
|---|---|---|---|---|---|---|
| 26 | Cumberland | ME | 51 | 8,295 | 0.0 | 2.0 |
| 26 | Old Tappan | NJ | 90 | 5,944 | 0.0 | 2.0 |
| 26 | River Vale Township | NJ | 37 | 10,063 | 0.0 | 2.0 |
| 29 | Clinton | MA | Not ranked | 13,964 | 0.3 | 1.0 |
| 30 | Grosse Ile Township | MI | Not ranked | 10,135 | 0.1 | 1.8 |
| 31 | Norfolk | MA | 25 | 11,992 | 0.1 | 1.9 |
| 32 | Chatham Township | NJ | 48 | 10,219 | 0.0 | 2.3 |
| 33 | Chesterfield Township | NJ | 13 | 7,474 | 0.4 | 0.8 |
| 34 | Inverness | IL | Not ranked | 7,442 | 0.0 | 2.4 |
| 35 | Independence Township | NJ | 102 | 5,420 | 0.4 | 0.9 |
| 36 | Groveland | MA | 31 | 6,846 | 0.3 | 1.3 |
| 37 | Washington Township, Bergen County | NJ | 46 | 9,219 | 0.1 | 2.1 |
| 38 | Lone Grove | OK | Not ranked | 5,111 | 0.0 | 2.5 |
| 39 | Hawthorn Woods | IL | 95 | 8,651 | 0.2 | 1.8 |
| 40 | Kinnelon | NJ | 43 | 9,984 | 0.1 | 2.2 |
| 40 | Stillwater Town | NY | 47 | 7,300 | 0.1 | 2.2 |
| 40 | Olmsted Township | OH | 38 | 13,432 | 0.1 | 2.2 |
| 43 | New Providence | NJ | Not ranked | 13,592 | 0.0 | 2.6 |
| 44 | Mendham Township | NJ | 20 | 5,700 | 0.2 | 1.9 |
| 45 | Sagamore Hills | OH | 33 | 10,934 | 0.0 | 2.7 |
| 46 | Upper Providence Township, Delaware County | PA | 60 | 10,437 | 0.2 | 2.0 |
| 47 | Dover | MA | 12 | 6,118 | 0.2 | 2.1 |
| 48 | Andover Township | NJ | 69 | 5,870 | 0.0 | 2.9 |
| 48 | Millcreek Township, Lebanon County | PA | 78 | 5,783 | 0.0 | 2.9 |
| 50 | Mukwonago Town | WI | 36 | 8,167 | 0.6 | 0.6 |
| 51 | Plattekill Town | NY | 44 | 10,160 | 0.2 | 2.2 |
| 52 | Oconomowoc Town | WI | 11 | 8,741 | 0.3 | 1.9 |
| 53 | Whitestown Town | NY | 73 | 9,096 | 0.0 | 3.1 |
| 54 | Merrimac | MA | Not ranked | 7001 | 0.3 | 2.1 |
| 55 | Russell Township | OH | 7 | 5,219 | 0.2 | 2.5 |
| 56 | Holland Township | NJ | Not ranked | 5,081 | 0.4 | 1.8 |
| 56 | East Brandywine Township | PA | Not ranked | 9,123 | 0.4 | 1.8 |
| 58 | Clinton Township | NJ | 75 | 12,801 | 0.2 | 2.6 |
| 58 | Oradell | NJ | Not ranked | 8,181 | 0.2 | 2.6 |
| 60 | Montvale | NJ | 27 | 8,657 | 0.1 | 3.0 |
| 60 | Shawangunk Town | NY | Not ranked | 13,853 | 0.1 | 3.0 |
| 62 | Medway | MA | Not ranked | 13,405 | 0.4 | 2.0 |
| 62 | Kent Town | NY | 72 | 13,235 | 0.4 | 2.0 |
| 64 | Grafton | OH | Not ranked | 5,808 | 0.3 | 2.4 |
| 65 | Sabattus | ME | 93 | 5,064 | 0.2 | 2.8 |
| 65 | Fair Haven | NJ | Not ranked | 5,784 | 0.2 | 2.8 |
| 67 | Hamilton | MA | 89 | 8,075 | 0.1 | 3.2 |
| 68 | Huntington Woods | MI | Not ranked | 6,321 | 0.0 | 3.6 |
| 68 | Briarcliff Manor Village | NY | 15 | 8,267 | 0.0 | 3.6 |
| 70 | Spring Township, Centre County | PA | 67 | 7,944 | 0.4 | 2.1 |
| 70 | West Cocalico Township | PA | Not ranked | 7,446 | 0.4 | 2.1 |
| 72 | Bridgewater | VA | Not ranked | 6,167 | 0.0 | 3.7 |
| 72 | Waterford Town | WI | Not ranked | 6,505 | 0.0 | 3.7 |
| 74 | Nottingham | NH | Not ranked | 5,149 | 0.6 | 1.4 |
| 75 | Springfield Township | MI | Not ranked | 14,554 | 0.3 | 2.6 |
| 75 | New Boston | NH | Not ranked | 5,856 | 0.3 | 2.6 |
| 77 | Butler | NJ | Not ranked | 7,613 | 0.1 | 3.4 |
| 77 | Hardyston Township | NJ | Not ranked | 7,760 | 0.1 | 3.4 |
| 79 | Brookline | NH | Not ranked | 5,461 | 0.0 | 3.8 |
| 80 | West Vincent Township | PA | Not ranked | 5,887 | 0.3 | 2.7 |
| 81 | Goshen Town | NY | Not ranked | 8,798 | 0.2 | 3.1 |
| 81 | Waterford Town and Village | NY | Not ranked | 8,574 | 0.2 | 3.1 |
| 83 | Orland Hills | IL | Not ranked | 7,066 | 0.1 | 3.5 |
| 83 | Robbinsville Township | NJ | 98 | 14,635 | 0.1 | 3.5 |
| 83 | Dallas Township | PA | Not ranked | 9,354 | 0.1 | 3.5 |
| 86 | Raisin Township | MI | 100 | 7,760 | 0.8 | 0.8 |
| 87 | Sterling | MA | Not ranked | 8,175 | 0.5 | 2.0 |
| 87 | Olmsted Falls | OH | 26 | 8861 | 0.5 | 2.0 |
| 89 | North Hanover Township | NJ | Not ranked | 7,476 | 0.4 | 2.4 |
| 90 | Lebanon Township | NJ | Not ranked | 6,061 | 0.3 | 2.8 |
| 91 | Cresskill | NJ | Not ranked | 8,761 | 0.2 | 3.2 |
| 92 | Milliken | CO | Not ranked | 7,978 | 0.1 | 3.6 |
| 93 | Stow | MA | Not ranked | 7,234 | 0.6 | 1.7 |
| 93 | Oak Hill | WV | Not ranked | 8,140 | 0.6 | 1.7 |
| 95 | Glocester | RI | Not ranked | 10,281 | 0.4 | 2.5 |
| 96 | Lindenhurst | IL | Not ranked | 14,296 | 0.3 | 2.9 |
| 96 | Southborough | MA | Not ranked | 10,140 | 0.3 | 2.9 |
| 96 | Wanaque | NJ | Not ranked | 11,772 | 0.3 | 2.9 |
| 99 | Norwood | NJ | 29 | 5,816 | 0.2 | 3.3 |
| 99 | Upper Saddle River | NJ | 42 | 8,245 | 0.2 | 3.3 |
America's 10 most dangerous small towns
|
2021 Rank
|
City
|
State
|
2020 Rank
|
Population
|
VC per 1,000
|
PC per 1,000
|
|---|---|---|---|---|---|---|
| 1 | Emeryville | CA | 1 | 12,380 | 13.4 | 211.9 |
| 2 | Sauk Village | IL | Not ranked | 10,319 | 55.0 | 22.0 |
| 3 | Glendale | CO | 3 | 5,289 | 9.5 | 177.0 |
| 4 | Florida City | FL | 4 | 12,180 | 26.2 | 72.7 |
| 5 | Ocean City | MD | 6 | 6,905 | 13.2 | 104.3 |
| 6 | Marksville | LA | 8 | 5,369 | 22.2 | 62.0 |
| 7 | Osceola | AR | 10 | 6,653 | 25.9 | 47.5 |
| 8 | Hartsville | SC | Not ranked | 7,524 | 14.4 | 88.8 |
| 9 | Darlington | SC | Not ranked | 5,886 | 14.8 | 85.8 |
| 10 | Globe | AZ | 5 | 7,323 | 18.3 | 71.7 |
How we picked the safest small towns in America
We examined FBI crime report data and population information for 2019 (the most recent year for which complete data was available).
We excluded towns with populations below 5,000 and above 15,000. Cities outside those population parameters and those that failed to report complete crime data to the FBI were excluded.
To rank each city or town, 50% of the score was determined by the number of violent crimes per 1,000, and 50% of the score was determined by the number of property crimes per 1,000.
Each measurement was normalized on a 0–1 scale with 1 corresponding to the measurement that would most positively affect the final score. These adjusted measurements were then added together with the weights mentioned above to get a score of 100.
Although it didn’t impact rankings, we also examined poverty rates, median income, and education attainment. This data was used to provide additional insight into any trends or patterns that may correlate to why some cities or states may be more likely to report lower crime numbers than others. For more safe city data, check out our list of the 100 Safest Cities in America, and watch for our ranking of the safest (and most dangerous) metro areas—coming soon. Get all the details about how we rank the safest cities in our full methodology.
How to make a safe home anywhere
Whether your city made our list or not, we recommend being proactive about protecting your home and family. One of the best ways to stop a burglary before it happens is to add a home security system.
We have home security options for nearly every budget, including self-monitored systems with no monthly fees and professionally monitored systems starting as low as $10 per month.
To learn more about your home security options, check out our picks for Best Home Security Systems.
Check out our other safest cities reports
Sources
- US Census Bureau, Toukabri and Medina. “Latest City and Town Population Estimates of the Decade Show Three-Fourths of the Nation’s Incorporated Places Have Fewer Than 5,000 People,” May 21, 2020. Accessed October 6, 2021.
- Law Library, American Law and Legal Information, “Urban Crime: Are Crime Rates Higher In Urban Areas?,” Accessed October 6, 2021
- US Census Bureau, Semega, Kollar, Shrider, and Creamer. “Income and Poverty in the United States: 2019,” September 15, 2020. Accessed October 6, 2021.
- US Census Bureau, “Percent of Population Age 25 and over by Educational Attainment: 1940–2020,” Accessed October 6, 2021.
- FBI, “FBI Releases 2020 Crime Statistics,” September 27, 2021. Accessed October 6, 2021.


Recent Articles


The post 100 Safest Small Towns in America 2021 appeared first on SafeWise.
Article source here: 100 Safest Small Towns in America 2021