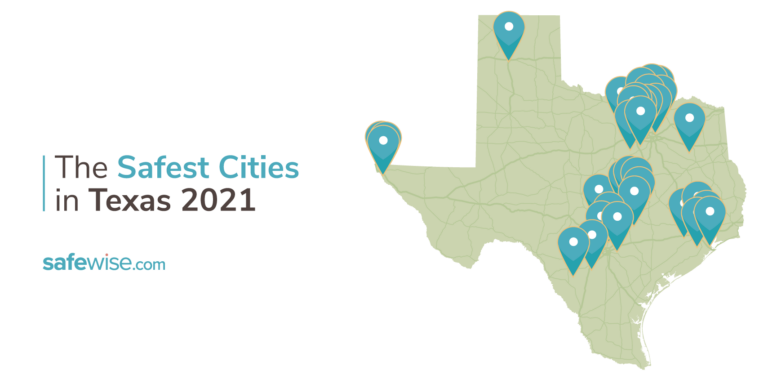
Texas’s 50 Safest Cities of 2021

The SafeWise Team is pleased to release the seventh annual Safest Cities report.
Here are the 10 Safest Cities in Texas for 2021
1. Trophy Club
2. Fulshear
3. Fair Oaks Ranch
4. Colleyville
5. Horizon City
6. Fate
7. Murphy
8. University Park
9. Helotes
10. Highland Village
See if your city made the top 50.
Texas is the second most-concerned state when it comes to gun violence. Over half of Texas survey respondents said they worry about gun violence happening to them.
Sadly, that concern wasn't unfounded when an argument led to gunfire at an Arlington high school on October 6. Four victims were confirmed, with three taken to local hospitals. The suspect was taken into custody.
This marks the 44th mass shooting in the state so far in 2021, according to the Gun Violence Archive—11 more than in the whole of 2020.
Texans’s daily concern about safety jumped 13 percentage points this year to 62%. Not only is that a huge leap from last year’s 49%—it’s also 15 percentage points higher than the national average. But those who live in one of Texas’s 50 safest cities may be less concerned due to significantly lower rates of crime than the rest of the state.
2021 Texas crime rates
Even though Texas’s crime rates are higher than national averages, The Lone Star State boasts the lowest crime rates in the West South Central region. Texas is 28% below Arkansas, which has the highest violent crime rate in the region at 5.8 incidents per 1,000 people. And Texas reports 24% fewer property crime incidents than Louisiana, which has the highest property crime rate in the region at 31.6 incidents per 1,000.
That said, the state saw slight upticks in both violent and property crime this year. Texas’s violent crime rate saw a small 2% increase from 4.1 to 4.2 incidents per 1,000 people. Likewise, the property crime rate rose by nearly 1% from 23.7 to 23.9 incidents per 1,000 people.

Level of concern and experience with crime in Texas
High levels of concern about crime and safety echo higher crime rates across The Lone Star State, but reported experiences of both violent and property crime fell year over year. Although Texans worry more than the rest of the US, 56% feel safe in the state—slightly higher than the national average of 55%.
- 60% of Texans think crime is increasing versus 11% that think it’s decreasing. Nationwide, 66% think crime is on the rise and 8% think it’s declining.
- Personal experience with violent crime went down 56% year over year, with 7% of survey respondents reporting a personal experience in the past 12 months, compared to 16% last year.
- Personal experience with property crime also went down 39% year over year, from 23% in 2020 to 14% this year.
Package theft was the most experienced crime in Texas, with 21% falling victim to porch pirates in the past 12 months (US 20%).

Crime concerns in Texas
We asked Texas residents which crimes they worry may happen to them. See if Texans are concerned about the same crime issues as the rest of the country.

View the complete 2021 State of Safety report.
Violent crime in Texas: Fear vs. reality
Concern about violent crime is 11 percentage points higher in Texas than the rest of the US. That jump in concern reflects a rising violent crime rate statewide. Texans expressed the second-highest overall concern about gun violence.
- 61% said they worry about gun violence every day (US 53%).
- 53% are most worried about a gun violence incident happening to them (US 38%).
- Texas saw 34 mass shooting incidents in 2020, compared to 30 in 2019.
- There were 258 officer-involved shooting incidents statewide in 2020, up from 247 in 2019.
- 47% of survey respondents worry about police violence daily (US 40%), but a full 60% have confidence in law enforcement (US 56%).
- The safest cities in Texas have 83% fewer violent crime incidents per 1,000 people than the rest of the state.
- 48% of survey participants use some form of personal protection—41% higher than the national average of 34%.
- 50% say their personal safety has been affected by the pandemic (US 44%), and 70% worry about the pandemic every day (US 62%).

Property crime in Texas: Fear vs. reality
Texans are 45% more concerned about property crime than the most Americans. Those higher concerns mirror a rising property crime rate in the state.
- Overall, property crime is the crime that Texans are most worried will happen to them, and it accounts for 85% of all crime reported to the FBI by Texas law enforcement agencies.
- The safest cities in Texas have 67% fewer property crime incidents per 1,000 people than the rest of the state.
- Larceny-theft is the most prevalent property crime, accounting for 72% of all reported incidents.
- Burglary makes up 16% of all property crime in the state, but just 12% among the safest cities.
- 65% of Texas survey participants use some form of property protection (US 62%) with dogs nabbing first place—33% use dogs or another guard animal to help protect their home.
- 42% say the security of their property has been affected by the pandemic (US 29%).

A closer look at the safest cities in Texas
For the purposes of this report, the terms “dangerous” and “safest” refer explicitly to crime rates as calculated from FBI crime data—no other characterization of any community is implied or intended.
- 266 cities met criteria to be considered for ranking.
- Trophy Club jumped three spots to be named the number one safest city in The Lone Star State.
- Fulshear slipped 1 spot to number 2 this year.
- Pflugerville made its debut on our list at number 48.
- 29 cities improved their ranking this year, with Prosper making the biggest leap from 91 to 23.
- 20 cities fell in rank this year, with Fredericksburg seeing the biggest drop from number 42 to 49.
- Only 1 city—Southlake—held onto its ranking year over year. Southlake is once again the twenty-ninth safest city in Texas.
- 82% (41) of the cities reported 0 counts of murder, and no safest city reported more than 2 murders.
- 3 of the safest cities have populations over 100,000: Allen, Frisco, and McKinney, making their low crime rates even more impressive.
- 32% (16) of the cities reported fewer than 100 total property crimes, and only 3 cities reported more than 1,000 property crimes (Allen, Frisco, and McKinney).
- The safest cities in Texas average 0.7 violent crime incidents and 8.0 property crime incidents per 1,000 people (81% and 62% below national averages, respectively).
The 50 Safest Cities in Texas

 Population13,031
 Median Income$142,483
 VC Rate 2021, 2020, 20190.1, 0.2, 0.2
![Circle Property]() PC Rate 2021, 2020, 20194.9, 5.3, 6.8
PC Rate 2021, 2020, 20194.9, 5.3, 6.8
-
Population13,967
-
Median Income$175,242
-
VC Rate 2021, 2020, 20190.0, 0.1, 0.7
![Circle Property]() PC Rate 2021, 2020, 20196.2, 4.4, 6.6
PC Rate 2021, 2020, 20196.2, 4.4, 6.6
-
Population10,151
-
Median Income$125,806
-
VC Rate 2021, 2020, 20190.6, 0.4, 0.3
![Circle Property]() PC Rate 2021, 2020, 20192.8, 4.6, 4.6
PC Rate 2021, 2020, 20192.8, 4.6, 4.6
-
Population27,499
-
Median Income$175,369
-
VC Rate 2021, 2020, 20190.2, 0.3, 0.2
![Circle Property]() PC Rate 2021, 2020, 20196.1, 5.5, 5.8
PC Rate 2021, 2020, 20196.1, 5.5, 5.8
-
Population20,131
-
Median Income$57,983
-
VC Rate 2021, 2020, 20190.3, 0.6, 0.8
![Circle Property]() PC Rate 2021, 2020, 20195.0, 5.6, 6.0
PC Rate 2021, 2020, 20195.0, 5.6, 6.0
-
Population15,378
-
Median Income$108,237
-
VC Rate 2021, 2020, 20190.4, 0.7, 0.9
![Circle Property]() PC Rate 2021, 2020, 20194.7, 4.8, 3.5
PC Rate 2021, 2020, 20194.7, 4.8, 3.5
-
Population20,962
-
Median Income$132,589
-
VC Rate 2021, 2020, 20190.4, 0.5, 0.3
![Circle Property]() PC Rate 2021, 2020, 20195.0, 5.4, 6.1
PC Rate 2021, 2020, 20195.0, 5.4, 6.1
-
Population25,434
-
Median Income$214,477
-
VC Rate 2021, 2020, 20190.2, 0.2, 0.4
![Circle Property]() PC Rate 2021, 2020, 20197.4, 11.8, 12.5
PC Rate 2021, 2020, 20197.4, 11.8, 12.5
-
Population9,881
-
Median Income$131,379
-
VC Rate 2021, 2020, 20190.2, 0.6, 0.9
![Circle Property]() PC Rate 2021, 2020, 20198.2, 16.3, 15.9
PC Rate 2021, 2020, 20198.2, 16.3, 15.9
-
Population16,721
-
Median Income$143,854
-
VC Rate 2021, 2020, 20190.5, 0.5, 0.7
![Circle Property]() PC Rate 2021, 2020, 20196.5, 7.9, 9.9
PC Rate 2021, 2020, 20196.5, 7.9, 9.9
-
Population26,926
-
Median Income$101,253
-
VC Rate 2021, 2020, 20190.5, 0.6, 0.5
![Circle Property]() PC Rate 2021, 2020, 20196.9, 7.7, 11.2
PC Rate 2021, 2020, 20196.9, 7.7, 11.2
-
Population15,818
-
Median Income$250,000
-
VC Rate 2021, 2020, 20190.4, 0.1, 0.6
![Circle Property]() PC Rate 2021, 2020, 20197.8, 7.0, 8.7
PC Rate 2021, 2020, 20197.8, 7.0, 8.7
-
Population12,472
-
Median Income$85,092
-
VC Rate 2021, 2020, 20190.6, 0.3, 0.1
![Circle Property]() PC Rate 2021, 2020, 20196.0, 5.8, 6.9
PC Rate 2021, 2020, 20196.0, 5.8, 6.9
-
Population9,129
-
Median Income$33,588
-
VC Rate 2021, 2020, 20191.0, 0.4, N/A
![Circle Property]() PC Rate 2021, 2020, 20193.7, 3.1, N/A
PC Rate 2021, 2020, 20193.7, 3.1, N/A
-
Population48,387
-
Median Income$133,266
-
VC Rate 2021, 2020, 20190.5, 0.5, 0.5
![Circle Property]() PC Rate 2021, 2020, 20197.2, 6.6, 6.3
PC Rate 2021, 2020, 20197.2, 6.6, 6.3
-
Population40,735
-
Median Income$104,097
-
VC Rate 2021, 2020, 20190.6, 0.8, 0.9
![Circle Property]() PC Rate 2021, 2020, 20196.5, 8.2, 8.0
PC Rate 2021, 2020, 20196.5, 8.2, 8.0
-
Population11,195
-
Median Income$113,532
-
VC Rate 2021, 2020, 20190.6, 0.9, 0.4
![Circle Property]() PC Rate 2021, 2020, 20196.8, 5.7, 3.7
PC Rate 2021, 2020, 20196.8, 5.7, 3.7
-
Population8,115
-
Median Income$58,586
-
VC Rate 2021, 2020, 20190.7, 1.6, 1.7
![Circle Property]() PC Rate 2021, 2020, 20196.7, 15.3, 15.0
PC Rate 2021, 2020, 20196.7, 15.3, 15.0
-
Population14,079
-
Median Income$56,214
-
VC Rate 2021, 2020, 20190.1, 0.9, 2.6
![Circle Property]() PC Rate 2021, 2020, 201910.9, 12.3, 20.3
PC Rate 2021, 2020, 201910.9, 12.3, 20.3
-
Population52,921
-
Median Income$93,637
-
VC Rate 2021, 2020, 20190.7, 1.0, 0.9
![Circle Property]() PC Rate 2021, 2020, 20197.2, 7.8, 8.7
PC Rate 2021, 2020, 20197.2, 7.8, 8.7
-
Population13,977
-
Median Income$112,176
-
VC Rate 2021, 2020, 20190.9, 1.4, 0.7
![Circle Property]() PC Rate 2021, 2020, 20196.7, 8.3, 13.0
PC Rate 2021, 2020, 20196.7, 8.3, 13.0
-
Population22,090
-
Median Income$96,670
-
VC Rate 2021, 2020, 20190.7, 0.6, 1.3
![Circle Property]() PC Rate 2021, 2020, 20197.6, 8.9, 12.2
PC Rate 2021, 2020, 20197.6, 8.9, 12.2
-
Population24,814
-
Median Income$140,815
-
VC Rate 2021, 2020, 20190.6, 2.8, 0.7
![Circle Property]() PC Rate 2021, 2020, 20198.8, 8.3, 11.2
PC Rate 2021, 2020, 20198.8, 8.3, 11.2
-
Population16,248
-
Median Income$131,230
-
VC Rate 2021, 2020, 20190.6, 1.4, 1.3
![Circle Property]() PC Rate 2021, 2020, 20199.0, 9.8, 11.1
PC Rate 2021, 2020, 20199.0, 9.8, 11.1
-
Population79,052
-
Median Income$134,184
-
VC Rate 2021, 2020, 20190.5, 0.6, 0.6
![Circle Property]() PC Rate 2021, 2020, 20199.2, 8.4, 9.2
PC Rate 2021, 2020, 20199.2, 8.4, 9.2

-
Population80,170
-
Median Income$101,845
-
VC Rate 2021, 2020, 20190.7, 1.2, 1.7
![Circle Property]() PC Rate 2021, 2020, 20198.4, 12.2, 13.9
PC Rate 2021, 2020, 20198.4, 12.2, 13.9
-
Population9,350
-
Median Income$92,159
-
VC Rate 2021, 2020, 20191.3, 0.2, 0.1
![Circle Property]() PC Rate 2021, 2020, 20194.5, 5.7, 6.4
PC Rate 2021, 2020, 20194.5, 5.7, 6.4
-
Population12,721
-
Median Income$94,956
-
VC Rate 2021, 2020, 20190.8, 1.2, 0.9
![Circle Property]() PC Rate 2021, 2020, 20198.2, 6.5, 11.1
PC Rate 2021, 2020, 20198.2, 6.5, 11.1
-
Population33,049
-
Median Income$230,700
-
VC Rate 2021, 2020, 20190.3, 0.3, 0.7
![Circle Property]() PC Rate 2021, 2020, 201911.7, 13.8, 11.7
PC Rate 2021, 2020, 201911.7, 13.8, 11.7
-
Population9,179
-
Median Income$155,488
-
VC Rate 2021, 2020, 20191.3, 0.8, 0.5
![Circle Property]() PC Rate 2021, 2020, 20195.0, 6.0, 7.2
PC Rate 2021, 2020, 20195.0, 6.0, 7.2
-
Population7,283
-
Median Income$32,553
-
VC Rate 2021, 2020, 20191.2, 1.2, 2.7
![Circle Property]() PC Rate 2021, 2020, 20195.6, 8.1, 8.1
PC Rate 2021, 2020, 20195.6, 8.1, 8.1
-
Population10,475
-
Median Income$46,819
-
VC Rate 2021, 2020, 20190.8, 1.2, N/A
![Circle Property]() PC Rate 2021, 2020, 20199.3, 3.5, N/A
PC Rate 2021, 2020, 20199.3, 3.5, N/A

-
Population15,019
-
Median Income$73,600
-
VC Rate 2021, 2020, 20190.9, 1.2, 1.2
![Circle Property]() PC Rate 2021, 2020, 20199.3, 14.0, 11.9
PC Rate 2021, 2020, 20199.3, 14.0, 11.9
-
Population16,312
-
Median Income$56,140
-
VC Rate 2021, 2020, 20190.9, 0.9, 1.5
![Circle Property]() PC Rate 2021, 2020, 20199.4, 7.7, 6.1
PC Rate 2021, 2020, 20199.4, 7.7, 6.1

-
Population8,670
-
Median Income$41,875
-
VC Rate 2021, 2020, 20191.2, 2.3, 2.4
![Circle Property]() PC Rate 2021, 2020, 20198.0, 6.7, 12.3
PC Rate 2021, 2020, 20198.0, 6.7, 12.3
-
Population61,314
-
Median Income$92,426
-
VC Rate 2021, 2020, 20191.1, 0.9, 1.3
![Circle Property]() PC Rate 2021, 2020, 20198.5, 9.3, 11.3
PC Rate 2021, 2020, 20198.5, 9.3, 11.3

-
Population10,604
-
Median Income$43,140
-
VC Rate 2021, 2020, 20190.6, 1.3, 0.7
![Circle Property]() PC Rate 2021, 2020, 201912.5, 19.9, 21.0
PC Rate 2021, 2020, 201912.5, 19.9, 21.0

-
Population78,332
-
Median Income$71,410
-
VC Rate 2021, 2020, 20191.0, 1.0, 1.2
![Circle Property]() PC Rate 2021, 2020, 20199.3, 9.8, 9.8
PC Rate 2021, 2020, 20199.3, 9.8, 9.8
-
Population42,181
-
Median Income$123,802
-
VC Rate 2021, 2020, 20190.6, 0.7, 0.7
![Circle Property]() PC Rate 2021, 2020, 201912.4, 12.5, 12.7
PC Rate 2021, 2020, 201912.4, 12.5, 12.7

-
Population105,961
-
Median Income$106,736
-
VC Rate 2021, 2020, 20190.8, 1.1, 1.0
![Circle Property]() PC Rate 2021, 2020, 201910.9, 12.4, 12.5
PC Rate 2021, 2020, 201910.9, 12.4, 12.5
-
Population72,979
-
Median Income$96,253
-
VC Rate 2021, 2020, 20190.9, 1.0, 1.2
![Circle Property]() PC Rate 2021, 2020, 201910.5, 10.8, 12.0
PC Rate 2021, 2020, 201910.5, 10.8, 12.0
-
Population13,657
-
Median Income$71,299
-
VC Rate 2021, 2020, 20191.1, 1.3, 0.9
![Circle Property]() PC Rate 2021, 2020, 20199.3, 12.6, 13.4
PC Rate 2021, 2020, 20199.3, 12.6, 13.4
-
Population15,253
-
Median Income$88,065
-
VC Rate 2021, 2020, 20191.2, 1.2, 0.4
![Circle Property]() PC Rate 2021, 2020, 20198.9, 12.8, 11.3
PC Rate 2021, 2020, 20198.9, 12.8, 11.3
-
Population32,112
-
Median Income$97,277
-
VC Rate 2021, 2020, 20191.2, 1.2, 1.1
![Circle Property]() PC Rate 2021, 2020, 20198.7, 8.8, 9.7
PC Rate 2021, 2020, 20198.7, 8.8, 9.7
-
Population34,841
-
Median Income$34,339
-
VC Rate 2021, 2020, 20191.2, 1.3, 1.4
![Circle Property]() PC Rate 2021, 2020, 20198.6, 7.3, 8.8
PC Rate 2021, 2020, 20198.6, 7.3, 8.8
-
Population8,945
-
Median Income$68,417
-
VC Rate 2021, 2020, 20191.3, 1.1, 4.2
![Circle Property]() PC Rate 2021, 2020, 20198.0, 6.3, 9.3
PC Rate 2021, 2020, 20198.0, 6.3, 9.3

-
Population199,445
-
Median Income$127,133
-
VC Rate 2021, 2020, 20190.8, 0.9, 1.0
![Circle Property]() PC Rate 2021, 2020, 201912.0, 13.6, 14.9
PC Rate 2021, 2020, 201912.0, 13.6, 14.9

-
Population66,729
-
Median Income$88,232
-
VC Rate 2021, 2020, 20191.0, N/A, 1.7
![Circle Property]() PC Rate 2021, 2020, 201912.4, N/A, 15.8
PC Rate 2021, 2020, 201912.4, N/A, 15.8
-
Population11,562
-
Median Income$49,888
-
VC Rate 2021, 2020, 20191.1, 1.1, 0.8
![Circle Property]() PC Rate 2021, 2020, 201911.3, 10.4, 12.8
PC Rate 2021, 2020, 201911.3, 10.4, 12.8
-
Population200,615
-
Median Income$89,964
-
VC Rate 2021, 2020, 20191.4, 1.5, 1.5
![Circle Property]() PC Rate 2021, 2020, 20199.9, 10.4, 13.4
PC Rate 2021, 2020, 20199.9, 10.4, 13.4
How we determined the safest cities
Learn how we identified the safest cities on our methodology page.
How to make a safe home anywhere
Whether your city made our list or not, we encourage everyone to be proactive about home security. Learn more about your home security options—and find out which companies we recommend for every budget and lifestyle in our roundup of the Best Home Security Systems.
Didn't find your city in the top 50?
We calculated crime rates for every city in the state that met our population threshold, based on the state’s median population. See how the remaining cities ranked in the list below.
NOTE: If you don’t see your city on the list, it means that it was below the population threshold or didn’t submit a complete crime report to the FBI in 2019.
|
2021 Rank
|
City
|
Population
|
VC per 1,000
 |
PC per 1,000
|
|---|---|---|---|---|
| 51 | Seminole | 7.78K | 1.4 | 10.7 |
| 52 | Roanoke | 9.56K | 1.3 | 11.8 |
| 53 | Missouri City | 75.75K | 1.4 | 10.7 |
| 54 | Forney | 25.37K | 1.3 | 11.9 |
| 55 | Perryton | 8.58K | 1.3 | 12.1 |
| 56 | League City | 109.40K | 1.1 | 13.6 |
| 57 | Ennis | 20.10K | 0.8 | 16.6 |
| 58 | Woodway | 9.03K | 1.8 | 10.1 |
| 59 | Buda | 18.15K | 1.1 | 14.9 |
| 60 | Pearland | 126.21K | 0.9 | 16.4 |
| 61 | Kyle | 49.86K | 1.4 | 13.2 |
| 62 | Seabrook | 14.61K | 1.4 | 13.6 |
| 63 | Lumberton | 13.08K | 1.7 | 11.5 |
| 64 | Alamo Heights | 8.81K | 0.8 | 17.8 |
| 65 | Rockwall | 46.10K | 1.1 | 16.1 |
| 66 | Royse City | 13.54K | 1.6 | 12.4 |
| 67 | Roma | 11.53K | 2.1 | 9.4 |
| 68 | Del Rio | 35.95K | 1.1 | 17.0 |
| 69 | Azle | 13.69K | 1.0 | 17.2 |
| 70 | Sulphur Springs | 16.22K | 2.0 | 10.4 |
| 71 | Rio Grande City | 14.61K | 1.0 | 18.4 |
| 72 | Lago Vista | 7.26K | 2.5 | 7.7 |
| 73 | Silsbee | 6.65K | 2.1 | 10.4 |
| 74 | Bellaire | 19.23K | 1.1 | 17.7 |
| 75 | Weatherford | 32.66K | 1.5 | 14.8 |
| 76 | Round Rock | 132.75K | 1.2 | 16.8 |
| 77 | Deer Park | 34.17K | 1.4 | 16.1 |
| 78 | Portland | 17.60K | 1.1 | 18.1 |
| 79 | Schertz | 42.34K | 1.8 | 13.2 |
| 80 | Bee Cave | 7.22K | 0.7 | 21.5 |
| 81 | Seagoville | 17.12K | 0.8 | 20.7 |
| 82 | Benbrook | 23.87K | 1.6 | 15.4 |
| 83 | Watauga | 24.69K | 1.6 | 15.5 |
| 84 | Galena Park | 10.93K | 2.0 | 12.9 |
| 85 | Plano | 291.61K | 1.5 | 16.8 |
| 86 | Kerrville | 23.90K | 2.1 | 12.6 |
| 87 | Mission | 85.71K | 1.2 | 18.9 |
| 88 | Highland Park | 9.25K | 1.0 | 20.8 |
| 89 | Boerne | 18.14K | 1.3 | 18.7 |
| 90 | Richardson | 123.89K | 1.4 | 18.4 |
| 91 | Gatesville | 12.31K | 1.9 | 16.4 |
| 92 | Bonham | 10.40K | 1.9 | 16.1 |
| 93 | Saginaw | 24.38K | 1.8 | 16.8 |
| 94 | White Settlement | 18.13K | 1.4 | 19.8 |
| 95 | Dumas | 14.29K | 1.7 | 17.6 |
| 96 | New Braunfels | 88.71K | 2.5 | 12.6 |
| 97 | Jacinto City | 10.63K | 1.2 | 21.4 |
| 98 | Sealy | 6.59K | 1.7 | 18.4 |
| 99 | Harker Heights | 32.53K | 2.0 | 16.3 |
| 100 | Kennedale | 8.79K | 2.2 | 15.1 |
| 101 | Stephenville | 21.75K | 1.8 | 18.1 |
| 102 | College Station | 119.25K | 1.9 | 17.6 |
| 103 | La Porte | 35.62K | 2.3 | 14.6 |
| 104 | Fort Stockton | 8.40K | 3.2 | 8.6 |
| 105 | Burleson | 48.74K | 2.3 | 14.9 |
| 106 | McAllen | 144.92K | 1.0 | 24.8 |
| 107 | Eagle Pass | 29.85K | 1.2 | 23.0 |
| 108 | Red Oak | 13.43K | 1.3 | 22.9 |
| 109 | North Richland Hills | 71.82K | 2.0 | 17.8 |
| 110 | Brownfield | 9.27K | 2.7 | 13.1 |
| 111 | Angleton | 19.66K | 2.5 | 14.1 |
| 112 | Ingleside | 10.37K | 2.2 | 16.8 |
| 113 | Selma | 12.05K | 1.6 | 21.4 |
| 114 | Belton | 22.74K | 1.9 | 19.0 |
| 115 | Farmers Branch | 41.93K | 1.5 | 22.4 |
| 116 | Euless | 58.14K | 1.8 | 20.4 |
| 117 | Hidalgo | 14.28K | 3.5 | 8.8 |
| 118 | Lake Dallas | 8.05K | 2.7 | 14.5 |
| 119 | The Colony | 44.36K | 2.8 | 14.5 |
| 120 | Burkburnett | 11.31K | 2.1 | 19.0 |
| 121 | Vidor | 10.50K | 1.9 | 21.1 |
| 122 | Floresville | 7.97K | 2.4 | 18.4 |
| 123 | Lewisville | 108.0K | 2.2 | 19.7 |
| 124 | Denton | 141.49K | 2.3 | 18.8 |
| 125 | Kirby | 8.84K | 2.5 | 17.9 |
| 126 | Kaufman | 7.58K | 2.2 | 19.7 |
| 127 | Port Neches | 12.81K | 2.9 | 15.5 |
| 128 | Bridgeport | 6.67K | 3.3 | 12.6 |
| 129 | Grand Prairie | 196.97K | 2.2 | 21.0 |
| 130 | La Feria | 7.34K | 2.6 | 18.4 |
| 131 | Mont Belvieu | 6.65K | 1.7 | 25.3 |
| 132 | Pharr | 80.90K | 2.9 | 17.6 |
| 133 | Dayton | 8.46K | 1.7 | 26.9 |
| 134 | Lampasas | 8.07K | 1.9 | 25.5 |
| 135 | Jersey Village | 8.01K | 2.2 | 23.1 |
| 136 | Dickinson | 21.10K | 3.1 | 17.7 |
| 137 | Cedar Hill | 48.87K | 2.0 | 25.6 |
| 138 | Laredo | 264.92K | 3.2 | 17.7 |
| 139 | El Paso | 686.79K | 3.5 | 15.1 |
| 140 | Lake Jackson | 27.62K | 2.1 | 25.4 |
| 141 | Bedford | 49.77K | 2.9 | 20.3 |
| 142 | Mineral Wells | 14.87K | 1.5 | 30.7 |
| 143 | Greenville | 28.61K | 2.7 | 22.2 |
| 144 | Alvin | 27.16K | 2.4 | 24.5 |
| 145 | Taylor | 17.41K | 2.4 | 24.8 |
| 146 | Temple | 77.56K | 2.8 | 22.2 |
| 147 | Glenn Heights | 13.52K | 3.3 | 18.4 |
| 148 | Irving | 245.42K | 2.5 | 24.4 |
| 149 | Cleburne | 30.86K | 3.3 | 19.1 |
| 150 | Liberty | 9.47K | 2.7 | 22.8 |
| 151 | Beeville | 12.87K | 2.2 | 27.0 |
| 152 | Kilgore | 15.05K | 3.1 | 21.0 |
| 153 | Decatur | 7.12K | 1.1 | 34.7 |
| 154 | Crowley | 16.03K | 2.4 | 26.1 |
| 155 | Seguin | 30.24K | 2.8 | 23.6 |
| 156 | Nederland | 17.56K | 3.5 | 18.9 |
| 157 | Rosenberg | 38.94K | 3.8 | 17.6 |
| 158 | Richmond | 12.09K | 3.7 | 18.5 |
| 159 | Andrews | 14.13K | 4.2 | 15.5 |
| 160 | DeSoto | 54.03K | 3.3 | 22.0 |
| 161 | Hillsboro | 8.48K | 2.0 | 30.9 |
| 162 | Hondo | 9.46K | 3.8 | 18.3 |
| 163 | Haltom City | 44.58K | 2.8 | 26.3 |
| 164 | Lacy-Lakeview | 6.72K | 2.5 | 28.9 |
| 165 | Freeport | 12.21K | 3.7 | 21.0 |
| 166 | Garland | 244.28K | 3.0 | 25.8 |
| 167 | Manor | 12.38K | 3.9 | 20.1 |
| 168 | Denison | 25.43K | 4.2 | 18.2 |
| 169 | Athens | 12.81K | 3.7 | 22.1 |
| 170 | San Marcos | 66.28K | 3.6 | 23.1 |
| 171 | Edinburg | 100.90K | 2.8 | 29.3 |
| 172 | Copperas Cove | 32.69K | 3.9 | 21.1 |
| 173 | Nacogdoches | 33.61K | 3.3 | 25.7 |
| 174 | Killeen | 151.83K | 3.8 | 22.6 |
| 175 | Pleasanton | 10.91K | 3.3 | 26.5 |
| 176 | Monahans | 7.77K | 4.6 | 17.4 |
| 177 | Clute | 11.74K | 3.9 | 22.5 |
| 178 | Hurst | 39.20K | 2.1 | 35.8 |
| 179 | Orange | 18.47K | 4.7 | 18.1 |
| 180 | Forest Hill | 13.03K | 2.8 | 31.7 |
| 181 | Terrell | 18.40K | 2.4 | 34.3 |
| 182 | Abilene | 123.67K | 3.7 | 25.2 |
| 183 | Vernon | 10.31K | 4.7 | 18.5 |
| 184 | Lancaster | 39.80K | 3.7 | 25.5 |
| 185 | Dalhart | 8.34K | 4.2 | 22.3 |
| 186 | Universal City | 21.06K | 3.5 | 27.4 |
| 187 | Bryan | 86.63K | 4.3 | 22.3 |
| 188 | Converse | 28.60K | 5.3 | 16.1 |
| 189 | Live Oak | 16.28K | 2.0 | 39.6 |
| 190 | Brownsville | 184.42K | 4.2 | 24.7 |
| 191 | Elsa | 7.23K | 2.8 | 34.9 |
| 192 | Leon Valley | 11.64K | 1.2 | 46.3 |
| 193 | El Campo | 11.62K | 3.5 | 29.9 |
| 194 | Wichita Falls | 104.55K | 3.5 | 30.4 |
| 195 | San Juan | 37.54K | 4.6 | 22.9 |
| 196 | Sherman | 43.0K | 4.2 | 26.1 |
| 197 | San Angelo | 101.07K | 3.5 | 31.4 |
| 198 | Texas City | 49.66K | 4.0 | 28.2 |
| 199 | Tyler | 106.85K | 3.8 | 30.0 |
| 200 | Wharton | 8.63K | 4.6 | 24.6 |
| 201 | Rockport | 10.85K | 2.4 | 40.6 |
| 202 | Brownwood | 18.65K | 3.3 | 34.8 |
| 203 | Groves | 15.60K | 5.4 | 19.5 |
| 204 | Fort Worth | 915.24K | 4.4 | 26.9 |
| 205 | Granbury | 10.75K | 2.4 | 41.3 |
| 206 | South Houston | 17.66K | 4.6 | 25.7 |
| 207 | Brenham | 17.38K | 5.4 | 20.8 |
| 208 | Marble Falls | 7.05K | 3.3 | 35.6 |
| 209 | Duncanville | 39.43K | 4.4 | 27.8 |
| 210 | Gainesville | 16.69K | 5.3 | 22.2 |
| 211 | Hereford | 14.73K | 5.5 | 21.0 |
| 212 | Uvalde | 16.23K | 3.3 | 37.6 |
| 213 | Navasota | 7.80K | 4.7 | 27.2 |
| 214 | Katy | 19.97K | 3.0 | 39.7 |
| 215 | Longview | 81.78K | 4.6 | 29.5 |
| 216 | Los Fresnos | 7.99K | 6.6 | 15.5 |
| 217 | Weslaco | 41.73K | 3.7 | 36.6 |
| 218 | Palestine | 18.06K | 5.5 | 24.9 |
| 219 | Pasadena | 153.69K | 5.5 | 25.1 |
| 220 | Arlington | 402.30K | 5.1 | 28.1 |
| 221 | Cuero | 8.26K | 5.9 | 22.3 |
| 222 | Austin | 986.06K | 4.0 | 37.1 |
| 223 | Victoria | 67.58K | 5.1 | 29.2 |
| 224 | Kingsville | 25.40K | 5.1 | 29.6 |
| 225 | Port Arthur | 55.08K | 6.2 | 21.8 |
| 226 | Baytown | 77.71K | 4.2 | 36.5 |
| 227 | Galveston | 50.80K | 4.8 | 32.3 |
| 228 | Mount Pleasant | 16.31K | 5.5 | 28.5 |
| 229 | Mercedes | 16.88K | 4.0 | 39.5 |
| 230 | Richland Hills | 8.06K | 4.8 | 35.5 |
| 231 | Mesquite | 143.08K | 4.8 | 36.3 |
| 232 | Waco | 139.87K | 5.7 | 32.9 |
| 233 | Jasper | 7.65K | 3.7 | 47.5 |
| 234 | Stafford | 18.38K | 5.9 | 32.2 |
| 235 | La Marque | 17.09K | 4.2 | 45.4 |
| 236 | Big Spring | 28.28K | 5.4 | 37.1 |
| 237 | Texarkana | 37.40K | 4.2 | 45.7 |
| 238 | Addison | 16.34K | 4.9 | 43.0 |
| 239 | Harlingen | 65.48K | 4.2 | 48.1 |
| 240 | Henderson | 13.23K | 5.6 | 38.7 |
| 241 | Lufkin | 35.56K | 5.2 | 43.8 |
| 242 | Pecos | 10.45K | 8.9 | 17.8 |
| 243 | Balch Springs | 25.51K | 6.5 | 35.5 |
| 244 | Alamo | 19.90K | 4.6 | 49.2 |
| 245 | Alice | 18.86K | 5.5 | 44.0 |
| 246 | Corsicana | 23.82K | 7.4 | 31.2 |
| 247 | San Benito | 24.39K | 6.6 | 38.8 |
| 248 | Amarillo | 201.04K | 7.2 | 39.0 |
| 249 | Pampa | 17.15K | 7.4 | 38.1 |
| 250 | Corpus Christi | 329.32K | 7.9 | 34.5 |
| 251 | San Antonio | 1559.17K | 7.1 | 43.2 |
| 252 | Dallas | 1363.30K | 8.6 | 33.2 |
| 253 | Gonzales | 7.66K | 10.6 | 21.9 |
| 254 | Cleveland | 8.28K | 5.9 | 58.4 |
| 255 | Paris | 24.79K | 10.2 | 28.8 |
| 256 | Lamesa | 9.0K | 8.2 | 44.2 |
| 257 | Odessa | 123.47K | 10.4 | 29.4 |
| 258 | Levelland | 13.53K | 10.3 | 29.9 |
| 259 | Raymondville | 10.89K | 11.6 | 22.3 |
| 260 | Donna | 16.72K | 8.3 | 47.1 |
| 261 | Beaumont | 118.56K | 10.5 | 36.2 |
| 262 | Lubbock | 259.21K | 10.1 | 46.1 |
| 263 | Houston | 2355.61K | 10.7 | 43.2 |
| 264 | Snyder | 11.16K | 14.3 | 20.2 |
| 265 | Bellmead | 10.82K | 9.2 | 59.2 |
| 266 | Humble | 16.16K | 11.7 | 104.0 |
Find the safest cities in each state
Click on the state image or dropdown menu below to check out the safest cities for each state.
Related articles on SafeWise
Sources
FBI: Uniform Crime Reporting Program, “2019 Crime in the United States,” Accessed March 15, 2021.
US Census Bureau, "Data Explorer," Accessed November 18, 2020.
Best Places, “Find a Place Search Tool,” Accessed January 6, 2021.
SafeWise, “2021 State of Safety survey,” Accessed March 15, 2021.
Gun Violence Archive, “Past Summary Ledgers,” Accessed January 6, 2021.
Gun Violence Archive, “General Methodology,” Accessed March 15, 2021.
Melody Hicks, Ben Stickle, Joshua Harms, American Journal of Criminal Justice, “Assessing the Fear of Package Theft,” January 04, 2021. Accessed March 15, 2021.
For definitions and more on data sources, see our methodology page.


Recent Articles


The post Texas’s 50 Safest Cities of 2021 appeared first on SafeWise.
Article source here: Texas’s 50 Safest Cities of 2021