The 50 Safest Cities to Raise a Child in 2022

Making your home a happy place for you and your kids has a lot to do with where you live. We analyzed hundreds of cities across America to find cities with the lowest crime rates impacting families.
And though no neighborhood is guaranteed absolute safe, some cities have four times lower rates of violent crime1, property crime2, and sex offenders3—which may lead to a safer, happier, and less stressful life for your family.
Did your hometown make it on our safest cities list?
For the purposes of this report, the terms “safest” and “dangerous” refer explicitly to rankings based on data sources listed in our methodology—no other characterization of any community is implied or intended
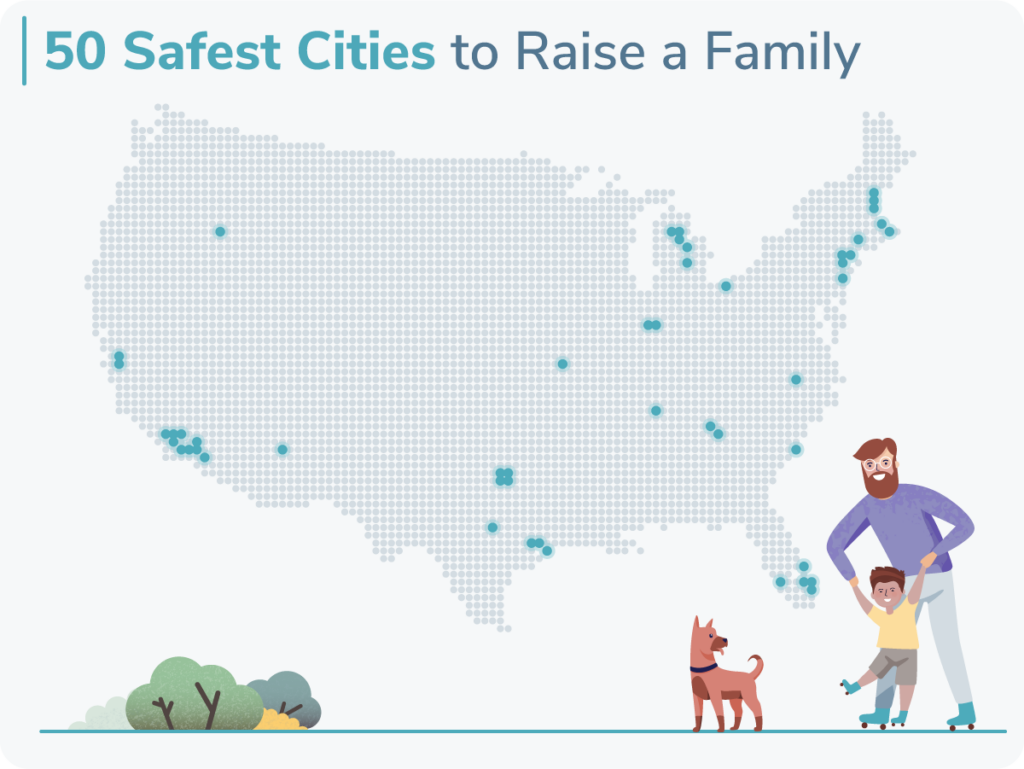
Here are the 10 safest cities in the US for families in 2022:
- Johns Creek, Georgia
- Newton, Massachusetts
- Carmel, Indiana
- Flower Mound, Texas
- Fishers, Indiana
- Cary, North Carolina
- Mission Viejo, California
- Lakewood Township, New Jersey
- Frisco, Texas
- San Ramon, California
See the complete list of America’s 50 safest cities for families, and read our methodology to learn how we calculated our rankings.
In this report
Why focus on cities for family safety?
Keeping your family safe involves many factors, but you can look at crimes that impact family safety for guidance. Knowing your city's rates for violent crime, property crime, and sex offenders can help you make better decisions about how to secure your home and protect your family.
And if you’re not happy with where you live, this list gives you the best options for a safer haven for your family.
Depending on what you’re looking for in a city, we have a safest city guide for you:
A closer look at crime in America’s safest cities for families
Crime statistics can’t paint the whole picture. But you’ll get a better understanding of what crimes take place more in some cities than others.
Let’s take a look at the per-capita differences between the safest and most dangerous cities. When you compare these to national averages, you’ll see a dramatic difference in crime rates.
More populous cities typically have higher rates of crime across the board. That doesn’t mean your big-city life can’t be safe for your family, but the risks may be greater and occur more frequently. Knowing which types of crimes are more prominent in your area can help you understand where to focus your family’s safety efforts.
Living in one of the safest cities lowers the risk of encountering crime. Plus, many of the safest cities are within commuting distance of the urban centers, so your family can still enjoy big-city amenities without spending most of your time in high crime areas.
The most dangerous cities have double crime rates of the national average (per 1,000 people):
- Over two times higher violent crime rates
- Over two times more sex offenders
- Nearly two times higher property crime rates
Safest cities for families: Violent crime rates
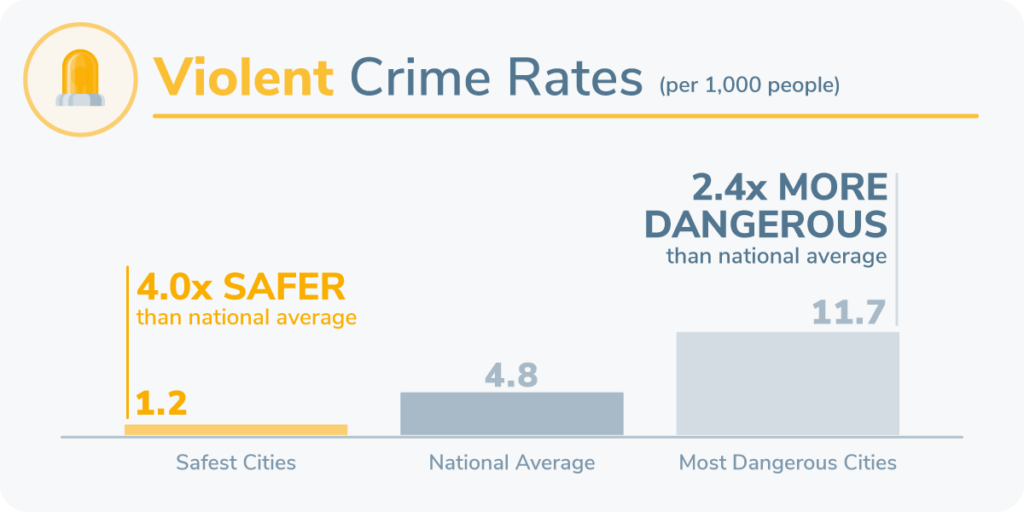
Parents want to protect their kids from violent environments whenever possible. The safest cities can see violent crime rates over four times lower than the national average and 10–20 times lower than the average rates of the most dangerous cities.
- The average violent crime rate for the most dangerous cities was 11.68 per 1,000, whereas the average for the safest cities was 1.15 per 1,000.
- 17 cities had a violent crime rate of less than 1 per 1,000. During our last report, 21 cities had a violent crime rate of less than 1 per 1,000.
- Out of the 50 safest cities, Miramar, Florida, had the highest violent crime rate of 2.43 per 1,000—still falling well below the national average of 4.84. Miramar improved by 11 ranks from our last report, coming in as the 48th safest city on our top 50 list.
- In the most dangerous 50 cities, 3 cities had violent crime rates of over 20 per 1,000 people: Memphis, Tennessee (23.52); Detroit, Michigan (21.79); and St. Louis, Missouri (20.16).
Safest cities for families: Property crime rates
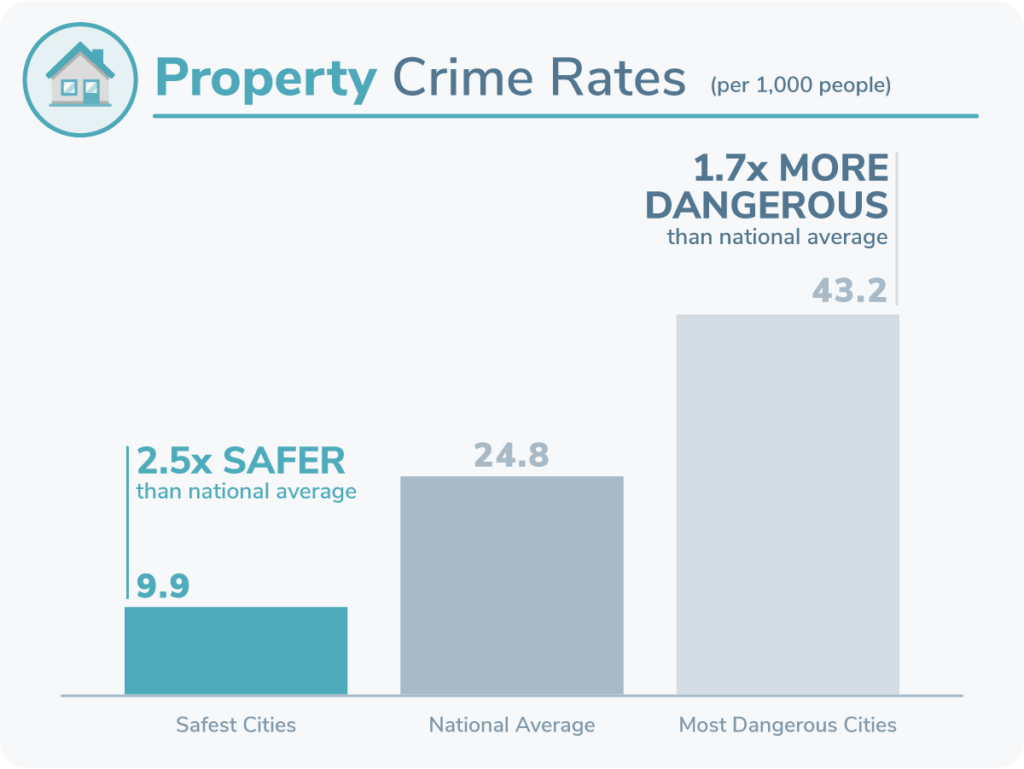
Property isn’t as valuable as human life, but it’s helpful to know if your city is more prone to crimes like burglary and car break-ins. And property crime is the most prevalent out of the crimes we analyzed.
- Johns Creek, Georgia, had the lowest property crime rate of 4.50 per 1,000 (which is over 5.5 times lower than the national average).
- The top 10 safest cities’ property crime average of 7.58 per 1,000 falls about three times lower than the national average (24.82).
- By comparison, the 50 most dangerous cities' property crime rates average 43.24 per 1,000—almost double the national rate of all the cities analyzed (24.82).
While you can’t guarantee your kid's bike won’t get stolen if they leave it on the lawn, it’s less likely to happen in the safest cities for families.
Safest cities for families: Registered sex offenders
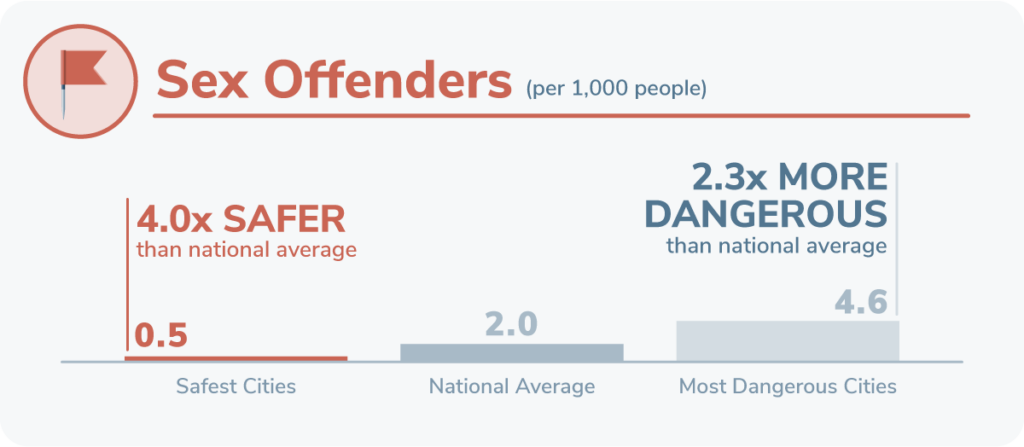
It may not be fun to think about, but sex offenders are a reality for families to face, and knowing there are far fewer living nearby can be a relief. Fortunately, our analysis showed the number of registered sex offenders was the least prevalent crime per capita:
- At a national level, the cities we analyzed reported an average of 1.95 sex offenders per 1,000 people.
- In the top 50 safest cities, the average rate of sex offenders is 0.53 per 1,000 people, far below the 4.57 rate of the 50 most dangerous cities.
- Six cities reported less than 0.1 sex offenders (per 1,000 people):
- Johns Creek, GA (0.4)
- Mount Pleasant, SC (0.04)
- Santa Clarita, CA (0.05)
- Newton, MA (0.05)
- Woodbridge Township, NJ (0.06)
- Edison Township, NJ (0.08)
States, regions, and cities that stand out for family safety
Indiana, Texas, and California each had two cities in the top 10. They aren’t too far from urban centers either, so families can still drive to enjoy the benefits of downtown living.
- Fisher and Carmel, Indiana, are about a half-hour away from downtown Indianapolis.
- Texas’ Flower Mound is about the same drive to either Fort Worth or Dallas. Frisco, Texas, is closer to Dallas. However, Fort Worth is still within easy driving distance.
- California’s Mission Viejo is southeast of Los Angeles, and San Ramon is east of San Francisco. So big city beaches, sights, and fun aren’t too far away.
Johns Creek, Georgia, came in with the highest score overall and the lowest property crime rate. Johns Creek also has the lowest rate of sex offenders (0.4) tied with Mount Pleasant, South Carolina.
The Wild West: Excluding California, western states like Washington, Utah, Oregon, Colorado, and New Mexico had no cities that broke into the top 50 safest cities.
- Gilbert, Arizona came in at rank 21, and Surprise, AZ, fell barely outside of the top 50, coming in at rank 54.
- Meridian, Idaho came in at rank 38, scoring well for low rates of violent crime and sex offenders.
Which states are the best for family safety?
California captured 11 slots in the safest cities for families list. A handful of other states had multiple cities with lower crime statistics than average: Texas (8), Michigan (5), Florida (5), and New Jersey (4).
New Jersey’s four cities were new to the list, along with two townships from Michigan (Shelby and Canton) and one city from Missouri (O'Fallon).
It’s worth noting these states also had their fair share of dangerous cities: California (3), Texas (4), Michigan (4), and Florida (2). So while you may be able to find a safe city in your dream state, it’s worth looking at which cities have the lowest crime rates.
America’s 10 most dangerous cities for families
In our analysis of over 430 cities, these 10 cities had the highest rates for violent crime, property crime, and sex offenders.
Geography and population
- Higher populations tended to have higher crime rates, with 2 of the top 10 cities having over 650 million people (Memphis, TN, and Detroit, Michigan).
- Kalamazoo, MI (#4) had a relatively low population but still faced higher crime rates.
Violent crime
- Richmond, VA, has the lowest violent crime rate out of the most dangerous cities at 3.59 per 1,000.
- Memphis, TN, has the highest violent crime rate of 23.52 per 1,000 people, followed by Detroit, MI (21.79) and St. Louis, MO (20.16).
- The following cities had the highest violent crime rates (per 1,000 people):
- Memphis, Tennessee (23.52)
- Detroit, Michigan (21.79)
- St Louis, Missouri (20.16)
- Little Rock, Arkansas (18.50)
- South Bend, Indiana (17.28)
- Cleveland, Ohio (16.57)
- Milwaukee, Wisconsin (15.97)
- Kansas City, Missouri (15.86)
- Rockford, Illinois (14.51)
- Lansing, Michigan (14.32)
Property crime
- Salt Lake City, UT, had the highest property crime rate of 73.52 per 1,000 people.
- Both Tennessee and Arkansas had two cities with the 10 worst property crime rates.
- These cities had the highest property crime rates:
- Salt Lake City, Utah (73.52)
- Chattanooga, Tennessee (63.56)
- St Louis, Missouri (58.30)
- Asheville, North Carolina (57.41)
- Miami Beach, Florida (57.39)
- Memphis, Tennessee (55.61)
- Fort Smith, Arkansas (55.31)
- Tacoma, Washington (55.07)
- Fayetteville, Arkansas (51.66)
- Oakland, California (51.66)
Sex offenders
- Richmond, VA, had the highest rate of sex offenders at 28.03 per 1,000 people, followed by Flint, Michigan, and Kalamazoo, Michigan.
- The following cities had the most sex offenders (per 1,000 people:)
- Richmond, Virginia (28.03)
- Flint, Michigan (12.88)
- Kalamazoo, Michigan (11.16)
- Grand Rapids, Michigan (9.71)
- St. Louis, Missouri (8.57)
- Orlando, Florida (8.26)
- Lansing, Michigan (7.89)
- Ogden, Utah (7.75)
- Dayton, Ohio (6.51)
- Beaumont, Texas (6.45)
Cities that made the last top 50 cities for families list
As new data comes in, our list changes. We had 23 cities from our last report improve their ranking; 21 cities dropped in ranking. And 28 new cities made an appearance on the list.
- Sugar Land, Texas improved its ranking the most, going from #46 to #15.
- Danbury, Connecticut, improved its ranking by 20 places.
- The following cities improved by at least 10 ranks:
-
- Frisco, Texas
- Allen Texas
- Coral Springs, Florida
- Meridian, Idaho
- Cape Coral, Florida
- The biggest drop in rank came from Hampton, Virginia, which went from #36 to #237 due to a higher sex offender rate of 3.50 per 1,000.
- A total of 12 cities dropped by more than 10 ranks.

Methodology: How we picked the safest cities for families
We compiled the list of the safest and most dangerous cities to raise a child by analyzing the FBI’s 2020 violent and property crime report statistics (the most recent data available at the time of our analysis).
Cities were ranked according to the rate of reported violent crimes (including aggravated assault, murder, rape, and robbery) and property crimes (burglary, arson, larceny-theft, and motor vehicle theft). We calculated our final safety score by considering crime data alongside the number of currently registered (as of March 14) sex offenders per capita.
We weighted both violent crime and property crime at 30% of a city’s total score. Sex offenders per capita made up 40% of the score. Scores were then standardized to calculate our rankings for the safest cities to raise a child.
Cities were excluded from this list if they fell below the population threshold of 75,000 or didn’t submit a complete crime report to the FBI. Violent and property crime rates were calculated per 1,000 people in each city.
We only included cities with populations over 75,000 to help filter out smaller townships and municipalities. We removed any cities with incomplete data (12 in total). Our final report includes a total of 430 cities.
Each city was ranked based on the factors below:
- Violent crimes per 1,000 (30%): More violent crimes negatively affect the score.
- Property crimes per 1,000 (30%): More property crimes negatively affect the score.
- Sex offenders per 1,000 (40%): More offenders negatively affect the score.
Each measurement was normalized on a 0-1 scale, with 1 corresponding to the measurement that would most positively affect the final score. These adjusted measurements were then added together with the weights mentioned above to get a score of 100.
How to make a safe home anywhere
Wherever you live, we encourage everyone to be proactive about home security.

Learn more about your home security options—and find out which companies we recommend for every budget and lifestyle in our roundup of the Best Home Security Systems.
Child Safety Resources on SafeWise
- Baby and Child Safety: FAQs about Keeping Children Safe
- 9 Things Every Child Should Know about Safety
- Best Wearable GPS Trackers for Kids
- What to Teach Your Children about Home Safety
- What Is a Child Safety Kit?
- Best Bike Helmets for Kids
- Best Baby Carriers for Hiking
- Tips for Staying Safe at Water Parks
Sources
- FBI, 'Crime Data Explorer— Table 8: Offenses Known to Law Enforcement by State by City 2020.” Accessed March 14, 2022.
- FBI, “Crime Data Explorer — Table 8: Offenses Known to Law Enforcement by State by City 2020,” Accessed March 14, 2022.
- City-data.com, “Registered Sex Offenders in the US.” Accessed March 14, 2022.

Recent Articles




The post The 50 Safest Cities to Raise a Child in 2022 appeared first on SafeWise.
Article source here: The 50 Safest Cities to Raise a Child in 2022

No comments:
Post a Comment